Nike 2016 Annual Report Download - page 22
Download and view the complete annual report
Please find page 22 of the 2016 Nike annual report below. You can navigate through the pages in the report by either clicking on the pages listed below, or by using the keyword search tool below to find specific information within the annual report.-
 1
1 -
2
-
3
-
4
-
5
-
6
-
7
-
8
-
9
-
10
-
11
-
 12
12 -
 13
13 -
 14
14 -
 15
15 -
 16
16 -
 17
17 -
 18
18 -
 19
19 -
 20
20 -
 21
21 -
 22
22 -
 23
23 -
 24
24 -
 25
25 -
 26
26 -
 27
27 -
 28
28 -
 29
29 -
 30
30 -
 31
31 -
 32
32 -
33
-
34
-
35
-
36
-
37
-
38
-
39
-
40
-
41
-
42
-
43
-
44
-
45
-
46
-
47
-
48
-
49
-
50
-
51
-
52
-
53
-
54
-
55
-
56
-
57
-
58
-
59
-
60
-
61
-
62
-
63
-
64
-
65
-
66
-
67
-
68
-
69
-
70
-
71
-
72
-
73
-
74
-
75
-
76
-
77
-
78
-
79
-
80
-
81
-
82
-
83
-
84
-
85
 |
 |

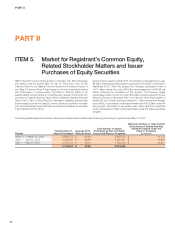
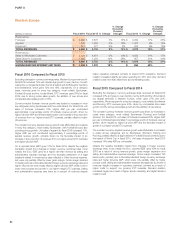
PART II
Results of Operations
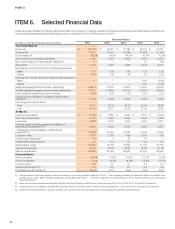
(Dollars in millions, except per share data) Fiscal 2016 Fiscal 2015 % Change Fiscal 2014 % Change
Revenues $ 32,376 $ 30,601 6% $ 27,799 10%
Cost of sales 17,405 16,534 5% 15,353 8%
Gross profit 14,971 14,067 6% 12,446 13%
Gross margin % 46.2% 46.0% 44.8%
Demand creation expense 3,278 3,213 2% 3,031 6%
Operating overhead expense 7,191 6,679 8% 5,735 16%
Total selling and administrative expense 10,469 9,892 6% 8,766 13%
% of Revenues 32.3% 32.3% 31.5%
Interest expense (income), net 19 28 — 33 —
Other (income) expense, net (140) (58) — 103 —
Income before income taxes 4,623 4,205 10% 3,544 19%
Income tax expense 863 932 -7% 851 10%
Effective tax rate 18.7% 22.2% 24.0%
Net income $ 3,760 $ 3,273 15% $ 2,693 22%
Diluted earnings per common share $ 2.16 $ 1.85 17% $ 1.49 24%
NIKE, INC. 2016 Annual Report and Notice of Annual Meeting 75
FORM 10-K