Nike 2016 Annual Report Download - page 33
Download and view the complete annual report
Please find page 33 of the 2016 Nike annual report below. You can navigate through the pages in the report by either clicking on the pages listed below, or by using the keyword search tool below to find specific information within the annual report.-
 1
1 -
2
-
3
-
4
-
5
-
6
-
7
-
8
-
9
-
10
-
11
-
12
-
13
-
14
-
15
-
16
-
17
-
18
-
19
-
20
-
21
-
22
-
 23
23 -
 24
24 -
 25
25 -
 26
26 -
 27
27 -
 28
28 -
 29
29 -
 30
30 -
 31
31 -
 32
32 -
 33
33 -
 34
34 -
 35
35 -
 36
36 -
 37
37 -
 38
38 -
 39
39 -
 40
40 -
 41
41 -
 42
42 -
 43
43 -
44
-
45
-
46
-
47
-
48
-
49
-
50
-
51
-
52
-
53
-
54
-
55
-
56
-
57
-
58
-
59
-
60
-
61
-
62
-
63
-
64
-
65
-
66
-
67
-
68
-
69
-
70
-
71
-
72
-
73
-
74
-
75
-
76
-
77
-
78
-
79
-
80
-
81
-
82
-
83
-
84
-
85
 |
 |

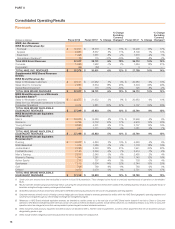
PART II
Higher ASP was due to higher full-price ASP, primarily reflecting inflationary
conditions in certain territories, and to a lesser extent, the favorable impact of
an increase in the proportion of revenues from our higher-priced DTC
business.
On a reported basis, EBIT increased 9%, despite the negative impact of
foreign currency exchange rates, primarily the Argentine Peso, Mexican Peso
and Korean Won, as gross margin expansion more than offset lower reported
revenues and higher selling and administrative expense as a percent of
revenues. Gross margin expanded 350 basis points due to higher full-price
ASP, lower warehousing and obsolescence costs, and growth in our higher-
margin DTC business, partially offset by shifts in mix to higher-cost products
and unfavorable standard foreign currency exchange rates. Selling and
administrative expense declined on a reported basis, but was higher as a
percent of revenues as higher operating overhead due to additional
investments in our DTC business and operating infrastructure, and higher
performance-based compensation were more than offset by changes in
foreign currency exchange rates. Demand creation expense also increased
driven by sports marketing and digital brand marketing costs, offset by the
impact of foreign currency exchange rates.
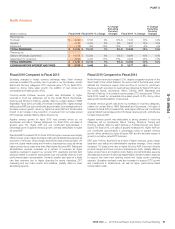
Fiscal 2015 Compared to Fiscal 2014
On a currency-neutral basis, fiscal 2015 revenues for Emerging Markets
increased 8%, driven by growth in 7 of 9 territories. Growth was led by SOCO
and Pacific which grew 28% and 26%, respectively. Revenues in our Mexico
and Brazil territories decreased 21% and 3%, respectively. The decrease in
Mexico was attributable to efforts to liquidate excess inventory in the
marketplace largely resulting from an inconsistent flow of product to
customers following distribution center transition issues in fiscal 2014, while
the decrease in Brazil was primarily due to challenging macroeconomic
conditions and comparison to strong sales related to the World Cup in fiscal
2014. On a category basis, revenues were higher in most key categories, led
by Sportswear, Running, Action Sports and the Jordan Brand, partially offset
by a decline in Football (Soccer). DTC revenues increased 51% compared to
fiscal 2014, driven by strong comparable store sales growth of 26%, the
addition of new stores and online sales growth.
The constant currency growth in footwear revenue for fiscal 2015 was
attributable to increases in several key categories, most notably Sportswear,
Action Sports, the Jordan Brand and Running. Unit sales of footwear
decreased 2% while higher ASP per pair contributed approximately 11
percentage points of footwear revenue growth. Higher ASP per pair was
primarily due to higher full-price ASP reflecting price increases in response to
inflationary conditions in certain Latin American countries, particularly
Argentina, as well as the favorable impact of growth in our higher-priced DTC
business.
Constant currency apparel revenue growth was due to increases in nearly all
key categories, primarily Sportswear, Running and Women’s Training,
partially offset by a decline in Football (Soccer) revenues due to higher World
Cup sales in fiscal 2014. Unit sales of apparel decreased 1% for fiscal 2015.
Higher ASP per unit contributed approximately 6 percentage points of
apparel revenue growth, primarily attributable to an increase in the proportion
of revenues from our higher-priced DTC business, and to a lesser extent,
higher full-price ASP driven by price increases in response to inflationary
conditions.
On a reported basis, EBIT decreased 14% primarily due to reported revenue
declines, lower gross margin and higher selling and administrative expense,
as well as the impact of weakening foreign currency exchange rates. Gross
margin decreased 140 basis points due to unfavorable standard foreign
currency exchange rates, higher inventory obsolescence and higher off-price
mix, partially offset by higher full-price ASP. Selling and administrative
expense increased due to higher operating overhead costs, primarily to
support DTC growth, as well as higher demand creation expense, in part as a
result of support for the World Cup in early fiscal 2015 and higher sports
marketing expense.
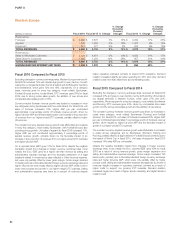
Global Brand Divisions
(Dollars in millions) Fiscal 2016 Fiscal 2015 % Change
% Change
Excluding
Currency
Changes Fiscal 2014 % Change
% Change
Excluding
Currency
Changes
Revenues $ 73 $ 115 -37% -30% $ 125 -8% -2%
(Loss) Before Interest and Taxes $ (2,596) $ (2,267) 15% $ (1,993) 14%
Global Brand Divisions primarily represent demand creation, operating
overhead and product creation and design expenses that are centrally
managed for the NIKE Brand. Revenues for Global Brand Divisions are
primarily attributable to NIKE Brand licensing businesses that are not part of a
geographic operating segment.
Fiscal 2016 Compared to Fiscal 2015
Global Brand Divisions’ loss before interest and taxes increased $329 million
for fiscal 2016 due to higher operating overhead and demand creation
expense, and to a lesser extent, lower revenues, largely resulting from the
expiration of certain football club endorsement agreements. Operating
overhead increased due to investments in operational infrastructure and
consumer-focused digital capabilities, partially offset by lower performance-
based compensation expenses. Demand creation expense increased due to
higher advertising and digital brand marketing expenses.
Fiscal 2015 Compared to Fiscal 2014
Global Brand Divisions’ loss before interest and taxes increased $274 million
in fiscal 2015, primarily due to higher operating overhead reflecting continued
investments in operational infrastructure, including digital capabilities,
consumer engagement and supply chain initiatives, as well as higher
performance-based compensation. Demand creation expense increased
slightly due to support for the World Cup in the first quarter of fiscal 2015 and
key brand and consumer events.
Converse
(Dollars in millions) Fiscal 2016 Fiscal 2015 % Change
% Change
Excluding
Currency
Changes Fiscal 2014 % Change
% Change
Excluding
Currency
Changes
Revenues $ 1,955 $ 1,982 -1% 2% $ 1,684 18% 21%
Earnings Before Interest and Taxes $ 487 $ 517 -6% $ 496 4%
86