Nike 2016 Annual Report Download - page 20
Download and view the complete annual report
Please find page 20 of the 2016 Nike annual report below. You can navigate through the pages in the report by either clicking on the pages listed below, or by using the keyword search tool below to find specific information within the annual report.-
 1
1 -
2
-
3
-
4
-
5
-
6
-
7
-
8
-
9
-
 10
10 -
 11
11 -
 12
12 -
 13
13 -
 14
14 -
 15
15 -
 16
16 -
 17
17 -
 18
18 -
 19
19 -
 20
20 -
 21
21 -
 22
22 -
 23
23 -
 24
24 -
 25
25 -
 26
26 -
 27
27 -
 28
28 -
 29
29 -
 30
30 -
31
-
32
-
33
-
34
-
35
-
36
-
37
-
38
-
39
-
40
-
41
-
42
-
43
-
44
-
45
-
46
-
47
-
48
-
49
-
50
-
51
-
52
-
53
-
54
-
55
-
56
-
57
-
58
-
59
-
60
-
61
-
62
-
63
-
64
-
65
-
66
-
67
-
68
-
69
-
70
-
71
-
72
-
73
-
74
-
75
-
76
-
77
-
78
-
79
-
80
-
81
-
82
-
83
-
84
-
85
 |
 |

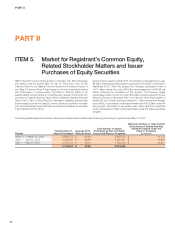
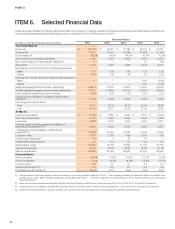
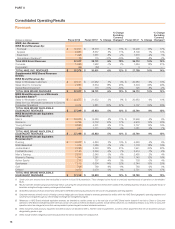
PART II
Selected Quarterly Financial Data
(Unaudited)
(In millions, except per share data)
1st Quarter 2nd Quarter 3rd Quarter 4th Quarter
2016 2015 2016 2015 2016 2015 2016 2015
Revenues $ 8,414 $ 7,982 $ 7,686 $ 7,380 $ 8,032 $ 7,460 $ 8,244 $ 7,779
Gross profit 3,995 3,721 3,501 3,327 3,689 3,426 3,786 3,593
Gross margin % 47.5% 46.6% 45.6% 45.1% 45.9% 45.9% 45.9% 46.2%
Net income 1,179 962 785 655 950 791 846 865
Earnings per common share:
Basic 0.69 0.56 0.46 0.38 0.56 0.46 0.50 0.50
Diluted 0.67 0.54 0.45 0.37 0.55 0.45 0.49 0.49
Weighted average common shares
outstanding 1,709.0 1,729.8 1,706.5 1,726.2 1,693.8 1,722.9 1,682.4 1,715.0
Diluted weighted average common shares
outstanding 1,754.5 1,772.4 1,751.4 1,769.6 1,737.3 1,767.7 1,723.1 1,759.6
Cash dividends declared per common
share 0.14 0.12 0.16 0.14 0.16 0.14 0.16 0.14
Price range of common stock:
High 58.86 40.15 67.65 49.88 68.19 49.75 65.44 52.75
Low 47.25 36.57 54.01 39.18 53.64 43.35 55.17 47.59
NIKE, INC. 2016 Annual Report and Notice of Annual Meeting 73
FORM 10-K