Nike 2016 Annual Report Download - page 26
Download and view the complete annual report
Please find page 26 of the 2016 Nike annual report below. You can navigate through the pages in the report by either clicking on the pages listed below, or by using the keyword search tool below to find specific information within the annual report.-
 1
1 -
2
-
3
-
4
-
5
-
6
-
7
-
8
-
9
-
10
-
11
-
12
-
13
-
14
-
15
-
 16
16 -
 17
17 -
 18
18 -
 19
19 -
 20
20 -
 21
21 -
 22
22 -
 23
23 -
 24
24 -
 25
25 -
 26
26 -
 27
27 -
 28
28 -
 29
29 -
 30
30 -
 31
31 -
 32
32 -
 33
33 -
 34
34 -
 35
35 -
 36
36 -
37
-
38
-
39
-
40
-
41
-
42
-
43
-
44
-
45
-
46
-
47
-
48
-
49
-
50
-
51
-
52
-
53
-
54
-
55
-
56
-
57
-
58
-
59
-
60
-
61
-
62
-
63
-
64
-
65
-
66
-
67
-
68
-
69
-
70
-
71
-
72
-
73
-
74
-
75
-
76
-
77
-
78
-
79
-
80
-
81
-
82
-
83
-
84
-
85
 |
 |

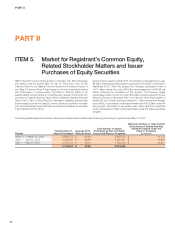
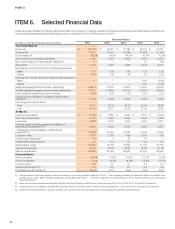
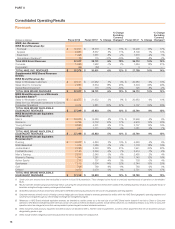
PART II
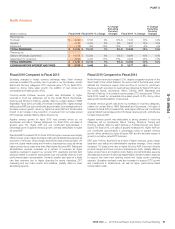
Fiscal 2016 Compared to Fiscal 2015
Demand creation expense increased 2% for fiscal 2016 compared to fiscal
2015, primarily due to investments in digital brand marketing, including for our
DTC business, as well as support for key brand events and initiatives, and
sports marketing investments, partially offset by lower advertising expense.
For fiscal 2016, changes in foreign currency exchange rates decreased
growth in Demand creation expense by approximately 6 percentage points.
Operating overhead expense increased 8% compared to fiscal 2015,
primarily as a result of continued investments in our DTC business, including
new store openings and higher variable expenses, as well as targeted
investments in operational infrastructure and consumer-focused digital
capabilities, partially offset by lower performance-based compensation.
Changes in foreign currency exchange rates decreased growth in Operating
overhead expense by approximately 4 percentage points for fiscal 2016.
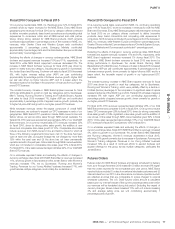
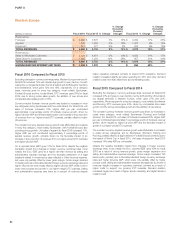
Fiscal 2015 Compared to Fiscal 2014
Demand creation expense increased 6% for fiscal 2015 compared to the prior
year, primarily due to support for key brand and consumer events, including
the World Cup in early fiscal 2015, increased digital brand marketing,
investments in DTC marketing and higher sports marketing expense.
Changes in foreign currency exchange rates decreased growth in Demand
creation expense by approximately 4 percentage points for fiscal 2015.
Operating overhead expense increased 16% compared to the prior year,
primarily driven by investments in our rapidly growing DTC business, including
new store openings and higher variable expenses, investments in operational
infrastructure and consumer-focused digital capabilities and higher
performance-based compensation. For fiscal 2015, changes in foreign
currency exchange rates decreased growth in Operating overhead expense
by approximately 3 percentage points.
Other (Income) Expense, Net
(In millions) Fiscal 2016 Fiscal 2015 Fiscal 2014
Other (income) expense, net $ (140) $ (58) $ 103
Other (income) expense, net comprises foreign currency conversion gains
and losses from the re-measurement of monetary assets and liabilities
denominated in non-functional currencies and the impact of certain foreign
currency derivative instruments, as well as unusual or non-operating
transactions that are outside the normal course of business.
Fiscal 2016 Compared to Fiscal 2015
Other (income) expense, net increased from $58 million of other income, net
for fiscal 2015 to $140 million of other income, net for fiscal 2016, driven by a
$26 million net change in foreign currency conversion gains and losses, a
favorable settlement of a legal judgment related to a bankruptcy case in
Western Europe and net gains from other non-operating items.
We estimate the combination of the translation of foreign currency-
denominated profits from our international business and the year-over-year
change in foreign currency-related gains and losses included in Other
(income) expense, net had an unfavorable impact on our Income before
income taxes of $423 million for fiscal 2016.
Fiscal 2015 Compared to Fiscal 2014
Other (income) expense, net shifted from $103 million of other expense, net
for fiscal 2014 to $58 million of other income, net for fiscal 2015, primarily
driven by a $147 million net change in foreign currency conversion gains and
losses, primarily due to significant hedge gains from available-for-sale
investments, as well as an adverse legal judgment in the prior year related to a
long outstanding bankruptcy case for a former customer in Western Europe.
We estimate the combination of the translation of foreign currency-
denominated profits from our international business and the year-over-year
change in foreign currency-related gains and losses included in Other
(income) expense, net had an unfavorable impact on our Income before
income taxes of $73 million for fiscal 2015.
Income Taxes
Fiscal 2016 Fiscal 2015 % Change Fiscal 2014 % Change
Effective tax rate 18.7% 22.2% (350) bps 24.0% (180) bps
Fiscal 2016 Compared to Fiscal 2015
The 350 basis point decrease in our effective tax rate for the fiscal year was
primarily due to an increase in the proportion of earnings from operations
outside the United States, which are generally subject to a lower tax rate.
Fiscal 2015 Compared to Fiscal 2014
The 180 basis point decrease in our effective tax rate for the fiscal year was
primarily due to the favorable resolution of audits in several jurisdictions.
Operating Segments
Our operating segments are evidence of the structure of the Company’s
internal organization. The NIKE Brand segments are defined by geographic
regions for operations participating in NIKE Brand sales activity.
Each NIKE Brand geographic segment operates predominantly in one
industry: the design, development, marketing and selling of athletic footwear,
apparel and equipment. The Company’s reportable operating segments for
the NIKE Brand are: North America, Western Europe, Central & Eastern
Europe, Greater China, Japan and Emerging Markets, and include results for
the NIKE, Jordan and Hurley brands. The Company’s NIKE Brand DTC
operations are managed within each geographic operating segment.
Converse is also a reportable segment for the Company and operates in one
industry: the design, marketing, licensing and selling of casual sneakers,
apparel and accessories.
As part of our centrally managed foreign exchange risk management
program, standard foreign currency rates are assigned twice per year to each
NIKE Brand entity in our geographic operating segments and Converse.
These rates are set approximately nine and twelve months in advance of the
future selling seasons to which they relate (specifically, for each currency, one
standard rate applies to the fall and holiday selling seasons and one standard
rate applies to the spring and summer selling seasons) based on average
market spot rates in the calendar month preceding the date they are
established. Inventories and Cost of sales for geographic operating segments
and Converse reflect use of these standard rates to record non-functional
currency product purchases into the entity’s functional currency. Differences
between assigned standard foreign currency rates and actual market rates
are included in Corporate together with foreign currency hedge gains and
losses generated from our centrally managed foreign exchange risk
management program and other conversion gains and losses.
NIKE, INC. 2016 Annual Report and Notice of Annual Meeting 79
FORM 10-K