Nike 2016 Annual Report Download - page 19
Download and view the complete annual report
Please find page 19 of the 2016 Nike annual report below. You can navigate through the pages in the report by either clicking on the pages listed below, or by using the keyword search tool below to find specific information within the annual report.-
 1
1 -
2
-
3
-
4
-
5
-
6
-
7
-
8
-
 9
9 -
 10
10 -
 11
11 -
 12
12 -
 13
13 -
 14
14 -
 15
15 -
 16
16 -
 17
17 -
 18
18 -
 19
19 -
 20
20 -
 21
21 -
 22
22 -
 23
23 -
 24
24 -
 25
25 -
 26
26 -
 27
27 -
 28
28 -
 29
29 -
30
-
31
-
32
-
33
-
34
-
35
-
36
-
37
-
38
-
39
-
40
-
41
-
42
-
43
-
44
-
45
-
46
-
47
-
48
-
49
-
50
-
51
-
52
-
53
-
54
-
55
-
56
-
57
-
58
-
59
-
60
-
61
-
62
-
63
-
64
-
65
-
66
-
67
-
68
-
69
-
70
-
71
-
72
-
73
-
74
-
75
-
76
-
77
-
78
-
79
-
80
-
81
-
82
-
83
-
84
-
85
 |
 |
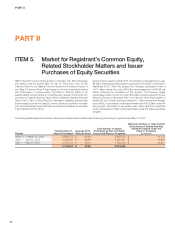
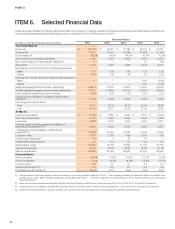
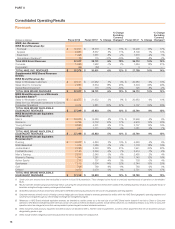
PART II
ITEM 6. Selected Financial Data
Unless otherwise indicated, the following disclosures reflect the Company’s continuing operations. All share and per share amounts are reflective of the two-for-
one stock splits that began trading at split-adjusted prices on December 24, 2015 and December 26, 2012.
(In millions, except per share data and financial ratios)
Financial History
2016 2015 2014 2013 2012
Year Ended May 31,
Revenues $ 32,376 $ 30,601 $ 27,799 $ 25,313 $ 23,331
Gross profit 14,971 14,067 12,446 11,034 10,148
Gross margin % 46.2% 46.0% 44.8% 43.6% 43.5%
Net income from continuing operations 3,760 3,273 2,693 2,451 2,257
Net income (loss) from discontinued operations — — — 21 (46)
Net income 3,760 3,273 2,693 2,472 2,211
Earnings per common share from continuing operations:
Basic 2.21 1.90 1.52 1.37 1.23
Diluted 2.16 1.85 1.49 1.34 1.20
Earnings per common share from discontinued operations:
Basic — — — 0.01 (0.03)
Diluted — — — 0.01 (0.02)
Weighted average common shares outstanding 1,697.9 1,723.5 1,766.7 1,794.6 1,839.9
Diluted weighted average common shares outstanding 1,742.5 1,768.8 1,811.6 1,832.9 1,879.2
Cash dividends declared per common share 0.62 0.54 0.47 0.41 0.35
Cash flow from operations, inclusive of discontinued
operations 3,096 4,680 3,013 3,032 1,932
Price range of common stock:
High 68.19 52.75 40.13 32.96 28.60
Low 47.25 36.57 29.56 21.95 19.65
At May 31,
Cash and equivalents $ 3,138 $ 3,852 $ 2,220 $ 3,337 $ 2,254
Short-term investments 2,319 2,072 2,922 2,628 1,503
Inventories 4,838 4,337 3,947 3,484 3,251
Working capital, excluding assets and liabilities of
discontinued operations(1)(2)(3) 9,667 9,255 8,319 9,391 7,271
Total assets, excluding assets of discontinued
operations(1)(2) 21,396 21,597 18,587 17,540 14,800
Long-term debt 2,010 1,079 1,199 1,210 228
Capital lease obligations(4) 15 5 74 81 —
Redeemable preferred stock 0.3 0.3 0.3 0.3 0.3
Shareholders’ equity 12,258 12,707 10,824 11,081 10,319
Year-end stock price 55.22 50.84 38.46 30.83 27.05
Market capitalization 92,867 87,044 66,921 55,124 49,546
Financial Ratios:
Return on equity 30.1% 27.8% 24.6% 23.1% 22.0%
Return on assets(1) 17.5% 16.3% 14.9% 15.3% 15.1%
Inventory turns 3.8 4.0 4.1 4.2 4.5
Current ratio at May 31(1) 2.8 2.5 2.7 3.4 3.0
Price/Earnings ratio at May 31 25.6 27.5 25.9 22.8 23.0
(1) Prior year amounts have been updated to reflect the adoption of Accounting Standards Update No. 2015-17, which requires all deferred tax assets and deferred tax liabilities to be
classified as non-current. Refer to Recently Adopted Accounting Standards in Note 1 — Summary of Significant Accounting Policies in the accompanying Notes to the Consolidated
Financial Statements.
(2) Assets of discontinued operations were $0 million, $0 million, $0 million, $0 million and $615 million for the years ended May 31, 2016, 2015, 2014, 2013 and 2012, respectively.
(3) Liabilities of discontinued operations were $0 million, $0 million, $0 million, $18 million and $170 million for the years ended May 31, 2016, 2015, 2014, 2013 and 2012, respectively.
(4) During the fiscal year ended May 31, 2015, the Company restructured the terms of certain capital leases, which subsequently qualified as operating leases.
72