Nike 2016 Annual Report Download - page 70
Download and view the complete annual report
Please find page 70 of the 2016 Nike annual report below. You can navigate through the pages in the report by either clicking on the pages listed below, or by using the keyword search tool below to find specific information within the annual report.-
 1
1 -
2
-
3
-
4
-
5
-
6
-
7
-
8
-
9
-
10
-
11
-
12
-
13
-
14
-
15
-
16
-
17
-
18
-
19
-
20
-
21
-
22
-
23
-
24
-
25
-
26
-
27
-
28
-
29
-
30
-
31
-
32
-
33
-
34
-
35
-
36
-
37
-
38
-
39
-
40
-
41
-
42
-
43
-
44
-
45
-
46
-
47
-
48
-
49
-
50
-
51
-
52
-
53
-
54
-
55
-
56
-
57
-
58
-
59
-
 60
60 -
 61
61 -
 62
62 -
 63
63 -
 64
64 -
 65
65 -
 66
66 -
 67
67 -
 68
68 -
 69
69 -
 70
70 -
 71
71 -
 72
72 -
 73
73 -
 74
74 -
 75
75 -
 76
76 -
 77
77 -
 78
78 -
 79
79 -
 80
80 -
81
-
82
-
83
-
84
-
85
 |
 |
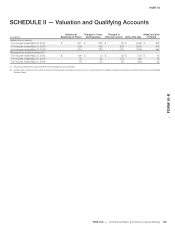
PART II
As of May 31,
(In millions) 2016 2015
ACCOUNTS RECEIVABLE, NET
North America $ 1,689 $ 1,737
Western Europe 378 344
Central & Eastern Europe 194 242
Greater China 74 84
Japan 129 134
Emerging Markets 409 461
Global Brand Divisions 76 88
Total NIKE Brand 2,949 3,090
Converse 270 258
Corporate 22 10
TOTAL ACCOUNTS RECEIVABLE, NET $ 3,241 $ 3,358
INVENTORIES
North America $ 2,363 $ 2,207
Western Europe 929 699
Central & Eastern Europe 210 169
Greater China 375 249
Japan 146 94
Emerging Markets 478 528
Global Brand Divisions 35 32
Total NIKE Brand 4,536 3,978
Converse 306 237
Corporate (4) 122
TOTAL INVENTORIES $ 4,838 $ 4,337
PROPERTY, PLANT AND EQUIPMENT, NET
North America $ 742 $ 632
Western Europe 589 451
Central & Eastern Europe 50 47
Greater China 234 254
Japan 223 205
Emerging Markets 109 103
Global Brand Divisions 511 484
Total NIKE Brand 2,458 2,176
Converse 125 122
Corporate 937 713
TOTAL PROPERTY, PLANT AND EQUIPMENT, NET $ 3,520 $ 3,011
Revenues by Major Product Lines
Revenues to external customers for NIKE Brand products are attributable to sales of footwear, apparel and equipment. Other revenues to external customers
consist primarily of sales by Converse.
Year Ended May 31,
(In millions) 2016 2015 2014
Footwear $ 19,871 $ 18,318 $ 16,208
Apparel 9,067 8,637 8,109
Equipment 1,496 1,631 1,670
Other 1,942 2,015 1,812
TOTAL NIKE CONSOLIDATED REVENUES $ 32,376 $ 30,601 $ 27,799
Revenues and Long-Lived Assets by
Geographic Area
After allocation of revenues for Global Brand Divisions, Converse and
Corporate to geographical areas based on the location where the sales
originated, revenues by geographical area are essentially the same as
reported above for the NIKE Brand operating segments with the exception of
the United States. Revenues derived in the United States were $15,304
million, $14,180 million and $12,711 million for the years ended May 31,
2016, 2015 and 2014, respectively. The Company’s largest concentrations of
long-lived assets primarily consist of the Company’s world headquarters and
distribution facilities in the United States and distribution facilities in Belgium,
China and Japan. Long-lived assets attributable to operations in the
United States, which are primarily composed of net property, plant &
equipment, were $2,241 million and $1,877 million at May 31, 2016 and
2015, respectively. Long-lived assets attributable to operations in Belgium
were $348 million and $234 million at May 31, 2016 and 2015, respectively.
Long-lived assets attributable to operations in China were $240 million and
$267 million at May 31, 2016 and 2015, respectively. Long-lived assets
attributable to operations in Japan were $223 million and $205 million at
May 31, 2016 and 2015, respectively.
Major Customers
No customer accounted for 10% or more of the Company’s net revenues
during the years ended May 31, 2016, 2015 and 2014.
NIKE, INC. 2016 Annual Report and Notice of Annual Meeting 123
FORM 10-K