Nike 2016 Annual Report Download - page 32
Download and view the complete annual report
Please find page 32 of the 2016 Nike annual report below. You can navigate through the pages in the report by either clicking on the pages listed below, or by using the keyword search tool below to find specific information within the annual report.-
 1
1 -
2
-
3
-
4
-
5
-
6
-
7
-
8
-
9
-
10
-
11
-
12
-
13
-
14
-
15
-
16
-
17
-
18
-
19
-
20
-
21
-
 22
22 -
 23
23 -
 24
24 -
 25
25 -
 26
26 -
 27
27 -
 28
28 -
 29
29 -
 30
30 -
 31
31 -
 32
32 -
 33
33 -
 34
34 -
 35
35 -
 36
36 -
 37
37 -
 38
38 -
 39
39 -
 40
40 -
 41
41 -
 42
42 -
43
-
44
-
45
-
46
-
47
-
48
-
49
-
50
-
51
-
52
-
53
-
54
-
55
-
56
-
57
-
58
-
59
-
60
-
61
-
62
-
63
-
64
-
65
-
66
-
67
-
68
-
69
-
70
-
71
-
72
-
73
-
74
-
75
-
76
-
77
-
78
-
79
-
80
-
81
-
82
-
83
-
84
-
85
 |
 |
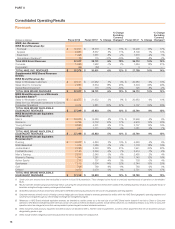
PART II
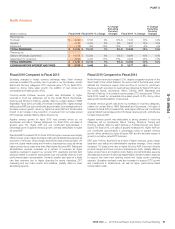
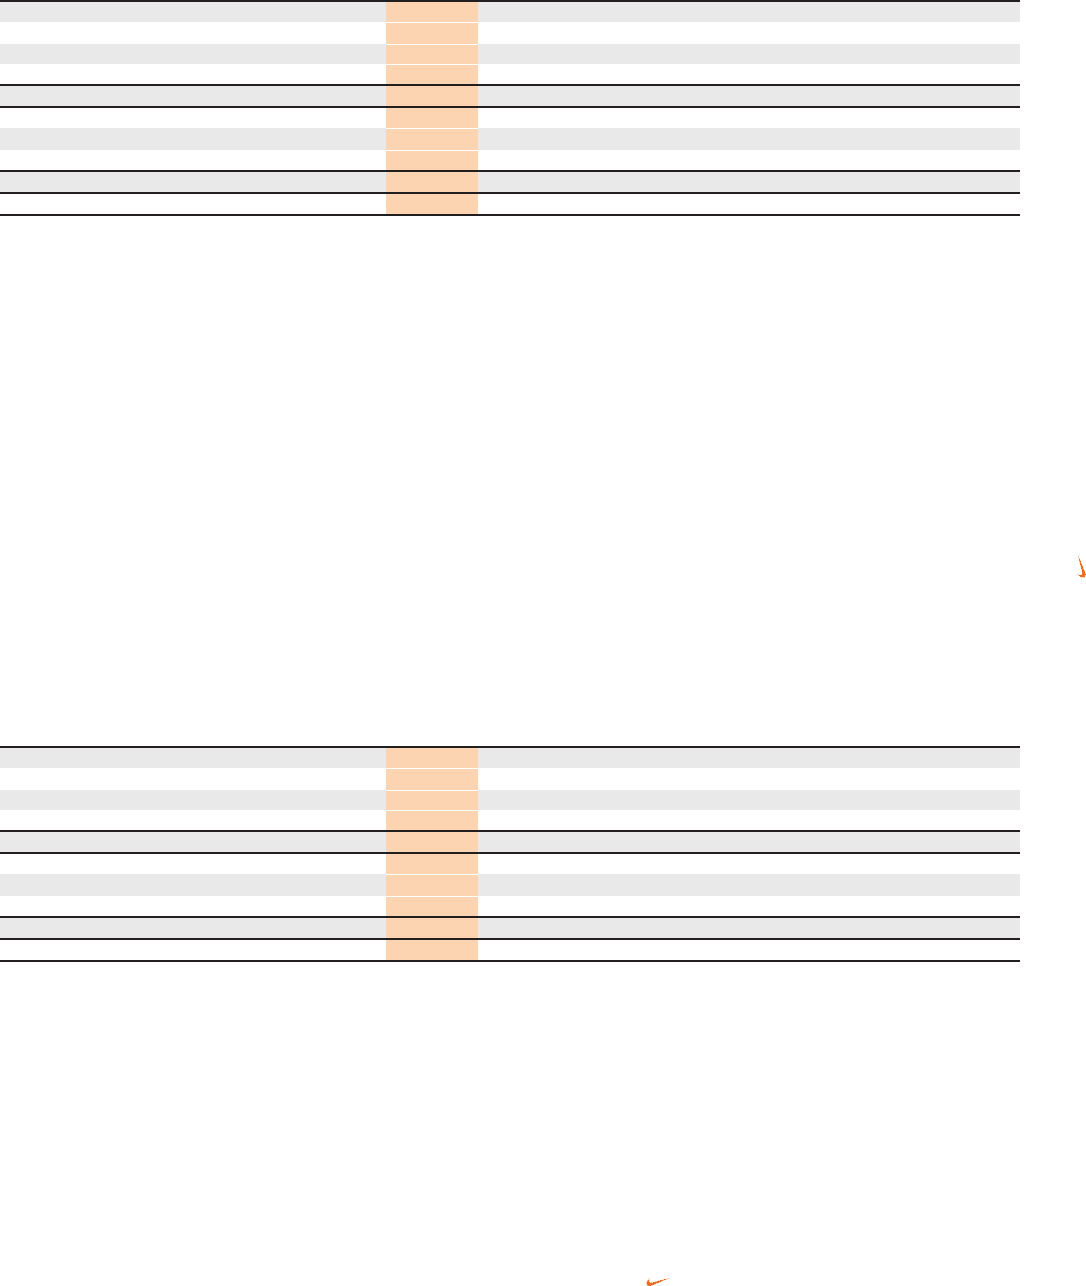
Japan
(Dollars in millions) Fiscal 2016 Fiscal 2015 % Change
% Change
Excluding
Currency
Changes Fiscal 2014 % Change
% Change
Excluding
Currency
Changes
Revenues by:
Footwear $ 570 $ 452 26% 34% $ 409 11% 23%
Apparel 228 230 -1% 5% 276 -17% -8%
Equipment 71 73 -3% 3% 86 -15% -6%
TOTAL REVENUES $ 869 $ 755 15% 22% $ 771 -2% 9%
Revenues by:
Sales to Wholesale Customers $ 587 $ 536 10% 16% $ 597 -10% 0%
Sales Direct to Consumer 282 219 29% 37% 174 26% 40%
TOTAL REVENUES $ 869 $ 755 15% 22% $ 771 -2% 9%
EARNINGS BEFORE INTEREST AND TAXES $ 174 $ 100 74% $ 131 -24%
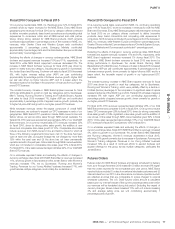
Fiscal 2016 Compared to Fiscal 2015
Excluding changes in foreign currency exchange rates, revenues for Japan
increased 22% for fiscal 2016, driven by growth in most key categories, led by
Sportswear, Running and the Jordan Brand. DTC revenues were 37% higher,
due to strong online sales growth, comparable store sales growth of 17% and
the addition of new stores.
Reported EBIT increased 74%, despite the weaker Yen. EBIT growth was
driven by higher reported revenues, gross margin expansion and significant
selling and administrative expense leverage. Gross margin expanded 270
basis points due to higher full-price ASP, in part due to lower discounts, as
well as growth in our higher-margin DTC business, lower product input costs
and warehousing efficiencies, which more than offset unfavorable standard
foreign currency exchange rates. Selling and administrative expense
decreased as a percent of revenues despite investments in operating
overhead to support our growing DTC business. Demand creation spending
for DTC marketing and brand events was largely offset by lower spending for
retail brand presentation and advertising costs.
Fiscal 2015 Compared to Fiscal 2014
Constant currency revenues for Japan increased 9% in fiscal 2015, driven
primarily by increases in Sportswear, Running, the Jordan Brand and NIKE
Basketball, partially offset by declines in Men’s Training, Golf and Women’s
Training. DTC revenues grew 40% in fiscal 2015 driven by a 20% increase in
comparable store sales, strong online sales growth and the addition of new
stores.
On a reported basis, fiscal 2015 EBIT decreased 24% compared to the prior
year period, reflecting the impact of the weaker Yen. Gross margin decreased
270 basis points as unfavorable standard foreign currency exchange rates
and higher product costs more than offset higher full-price ASP and an
increase in the proportion of revenues from our higher-margin DTC business.
Selling and administrative expense increased as a percent of revenues as
higher operating overhead, primarily to support our expanding DTC business,
was only partially offset by a decrease in demand creation expense.
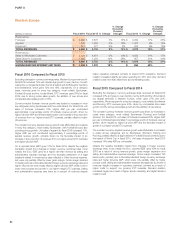
Emerging Markets
(Dollars in millions) Fiscal 2016 Fiscal 2015 % Change
% Change
Excluding
Currency
Changes Fiscal 2014 % Change
% Change
Excluding
Currency
Changes
Revenues by:
Footwear $ 2,536 $ 2,641 -4% 14% $ 2,642 0% 9%
Apparel 947 1,021 -7% 11% 1,061 -4% 5%
Equipment 218 236 -8% 11% 246 -4% 5%
TOTAL REVENUES $ 3,701 $ 3,898 -5% 13% $ 3,949 -1% 8%
Revenues by:
Sales to Wholesale Customers $ 3,049 $ 3,247 -6% 11% $ 3,483 -7% 2%
Sales Direct to Consumer 652 651 0% 23% 466 40% 51%
TOTAL REVENUES $ 3,701 $ 3,898 -5% 13% $ 3,949 -1% 8%
EARNINGS BEFORE INTEREST AND TAXES $ 892 $ 818 9% $ 952 -14%
Fiscal 2016 Compared to Fiscal 2015
Excluding changes in foreign currency exchange rates, fiscal 2016 revenues
for Emerging Markets increased 13%. Growth was attributable to higher
revenues in 7 of 9 territories, led by one of our largest territories, SOCO (which
includes Argentina, Uruguay and Chile), which grew 32%, and by Mexico and
Pacific (which includes Australia and New Zealand), which grew 31% and
27%, respectively. Revenues declined 5% in Brazil, primarily reflecting on-
going macroeconomic challenges. On a category basis, revenues grew in
nearly every key category, led by Sportswear and Running. DTC revenues
increased 23%, driven by the addition of new stores, comparable store sales
growth of 7% and online sales growth.
The constant currency growth in footwear revenue for fiscal 2016 was driven
by higher revenues in nearly every key category, most notably Sportswear
and Running. For fiscal 2016, unit sales of footwear increased 1%, while
higher ASP per pair contributed approximately 13 percentage points of
footwear revenue growth. Higher ASP was attributable to higher full-price
ASP, primarily reflecting inflationary conditions in certain territories, and to a
lesser extent, the favorable impact of an increase in the proportion of
revenues from our higher-priced DTC business.
The constant currency growth in apparel revenue was due to increases in
most key categories, led by Sportswear, Running and Women’s Training.
Fiscal 2016 unit sales of apparel decreased 2%, while higher ASP per unit
contributed approximately 13 percentage points of apparel revenue growth.
NIKE, INC. 2016 Annual Report and Notice of Annual Meeting 85
FORM 10-K