Proctor and Gamble 2005 Annual Report Download - page 2
Download and view the complete annual report
Please find page 2 of the 2005 Proctor and Gamble annual report below. You can navigate through the pages in the report by either clicking on the pages listed below, or by using the keyword search tool below to find specific information within the annual report.-
 1
1 -
 2
2 -
 3
3 -
 4
4 -
 5
5 -
 6
6 -
 7
7 -
 8
8 -
 9
9 -
 10
10 -
 11
11 -
 12
12 -
 13
13 -
14
-
15
-
16
-
17
-
18
-
19
-
20
-
21
-
22
-
23
-
24
-
25
-
26
-
27
-
28
-
29
-
30
-
31
-
32
-
33
-
34
-
35
-
36
-
37
-
38
-
39
-
40
-
41
-
42
-
43
-
44
-
45
-
46
-
47
-
48
-
49
-
50
-
51
-
52
-
53
-
54
-
55
-
56
-
57
-
58
-
59
-
60
-
61
-
62
-
63
-
64
-
65
-
66
-
67
-
68
-
69
-
70
-
71
-
72
 |
 |
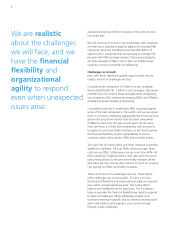
Net Sales
(in billions of dollars)
2004 20052003
51.4
56.7
43.4
Operating Cash Flow
(in billions of dollars)
2004 20052003
8.7 8.7
9.4
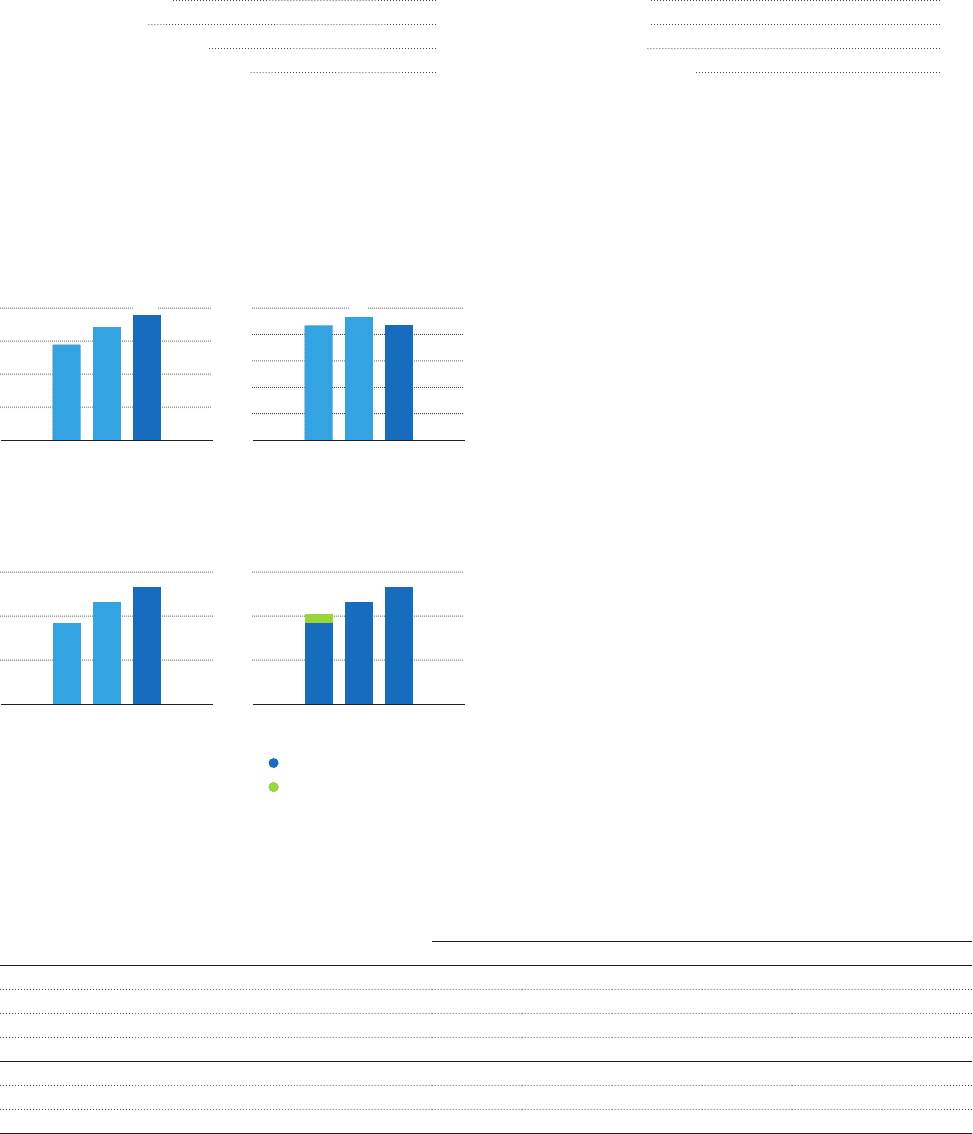
Diluted Net Earnings
(per common share)
2003 2004 2005
0
1
2
$3
Additional Earnings Information
(per common share, on a diluted basis)
2003 2004 2005
0
1
2
$3
Reported EPS
Restructuring Charges
1 Organization2005restructuringchargespersharetotal$0.19in2003.
TableofContents
FinancialHighlights
FinancialSummary(Unaudited)
LettertoShareholders 1
IntegratingGillette 10
P&G’sBillion-DollarBrands 12
GlobalBusinessUnitPerspective 14
FinancialContents 22
CorporateOfficers 62
BoardofDirectors 64
ShareholderInformation 65
Amountsinmillions
exceptpershareamounts
YearsEndedJune30
2004 2003 2002 2001 2000
NetSales $51,407 $43,377 $40,238 $39,244 $39,951
OperatingIncome 9,827 7,853 6,678 4,736 5,954
NetEarnings 6,481 5,186 4,352 2,922 3,542
NetEarningsMargin 12.6% 12.0% 10.8% 7.4% 8.9%
BasicNetEarningsperCommonShare $2.46 $1.95 $1.63 $1.08 $1.30
DilutedNetEarningsperCommonShare 2.32 1.85 1.54 1.03 1.23
DividendsperCommonShare 0.93 0.82 0.76 0.70 0.64