Proctor and Gamble 2005 Annual Report Download - page 33
Download and view the complete annual report
Please find page 33 of the 2005 Proctor and Gamble annual report below. You can navigate through the pages in the report by either clicking on the pages listed below, or by using the keyword search tool below to find specific information within the annual report.-
 1
1 -
2
-
3
-
4
-
5
-
6
-
7
-
8
-
9
-
10
-
11
-
12
-
13
-
14
-
15
-
16
-
17
-
18
-
19
-
20
-
21
-
22
-
 23
23 -
 24
24 -
 25
25 -
 26
26 -
 27
27 -
 28
28 -
 29
29 -
 30
30 -
 31
31 -
 32
32 -
 33
33 -
 34
34 -
 35
35 -
 36
36 -
 37
37 -
 38
38 -
 39
39 -
 40
40 -
 41
41 -
 42
42 -
 43
43 -
44
-
45
-
46
-
47
-
48
-
49
-
50
-
51
-
52
-
53
-
54
-
55
-
56
-
57
-
58
-
59
-
60
-
61
-
62
-
63
-
64
-
65
-
66
-
67
-
68
-
69
-
70
-
71
-
72
 |
 |
Management’sDiscussionandAnalysis TheProcter&GambleCompanyandSubsidiaries 29
exchangeincreased8%,wellabovetheCompany’starget.Organic
sales,whichexcludetheeffectsofacquisitions,divestituresandforeign
exchange,alsoincreased8%.
In 2 0 0 4 , unit vo lume incre a s e d 17% , wit h a l l GBUs and
geographic regions achieving unit volume growth. Excluding
theimpactofacquisitionsanddivestitures,primarilyWella,unitvolume
fortheCompanyincreased10%.Netsaleswere$51.41billionin2004,
an increase of19%comparedto 2003.Organic salesincreased
8%,wellabovetheCompany’starget.Netsalesincreasedbehind
volumegrowth,includingtheadditionofWella,andapositiveforeign
exchangeimpactof4%dueprimarilytothestrengtheningoftheEuro,
BritishpoundandCanadiandollar.Productmixreducedsalesgrowthby1%,
reflectinghighergrowthindevelopingmarkets,includingGreaterChina
andLatinAmerica,whichgenerallyhaveanaverageunitsalesprice
lowerthantheCompanyaverage.Pricingadjustmentsreducedsales
growthby1%aswesharpenedFamilyCareandCoffeecategorypricing
toremaincompetitiveonshelfandreducedpricestoimproveconsumer
valueandstimulategrowthinselectedproductcategories,including
FabricCareandFeminineCare.
OperatingCosts
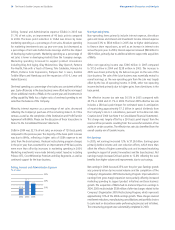
Gross margin in 2005 was 51.0%, a decrease of 20 basis
points compared with theprior year. Higher commoditycosts
reduced grossmargin byover100basispoints.Wewere able
tooffsetapproximately halfof this impact throughthe scale
benefits of volume growth, with additional offset coming
fromsupplychainsavingsandpricing.Priceincreasestorecover
commoditycostsweretakeninFamilyCare,PetHealthandNutrition,
CoffeeandcertainFabricCaremarkets.Grossmarginalsocontracted
duetostronggrowthindevelopingmarkets.Grossmarginindeveloping
marketsisgenerallylowerthantheCompanyaverage.Additionally,the
saleoftheJuicebusinessinAugustof2004providedapositiveimpact
togrossmargin,astheJuicebusinesshadalowergrossmarginthan
theCompanyaverage.
In2004,grossmarginwas51.2%,anincreaseof220basispoints
versusthepreviousyear.Chargesfortherestructuringprogramthat
wassubstantiallycompletedin2003accountedfor80basispoints
oftheimprovement.Oftheremaininggrossmarginexpansion,
approximately90basispointsweredrivenbythescalebenefitofincreased
volumeand40basispointswereduetotheadditionofWella,which
hasahighergrossmarginthanthebalanceoftheCompany.Supply
chainsavingsandfavorableproductmixbenefitswereoffsetbythe
impactofhighercommoditycostsandpricingactions.
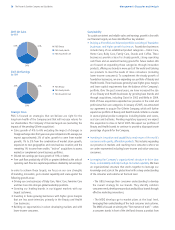
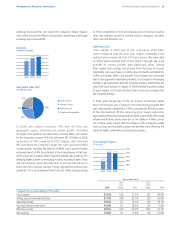
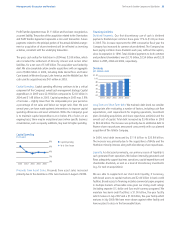
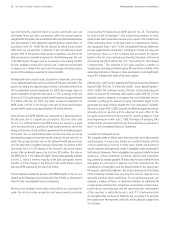
Geographic Sales Split
(FY 2005 Net Sales)
48%
5%
23%
24%
North America
Western Europe
Northeast Asia
Developing Geographies
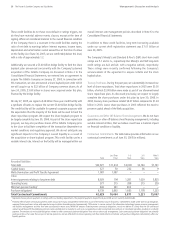
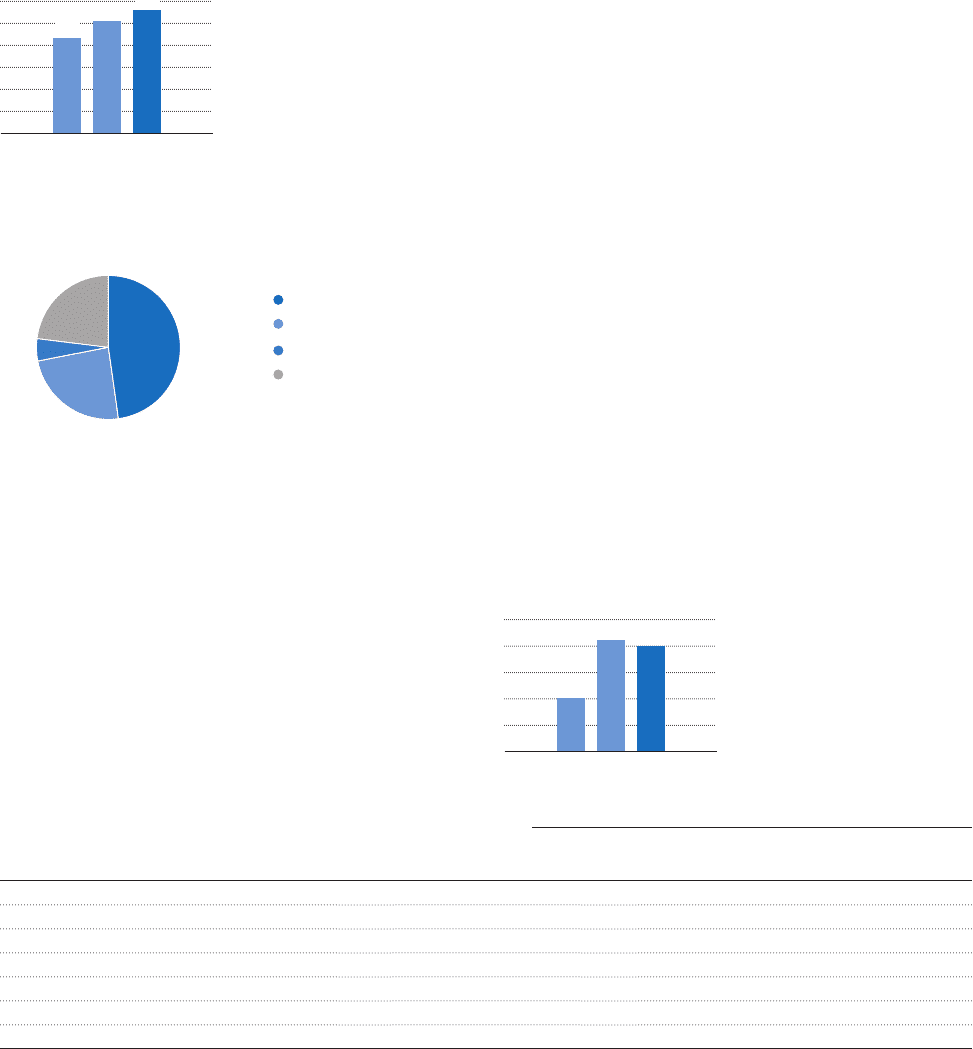
YearsendedJune30
Basis Basis
pointpoint
change 2004 change 2003
Comparisonsasapercentageofnetsales
Grossmargin (20) 51.2% 220 49.0%
Selling,generalandadministrative (40) 32.1% 120 30.9%
Operatingmargin 20 19.1% 100 18.1%
Earningsbeforeincometaxes 20 18.2% 80 17.4%
Effectivetaxrate (20) 30.7% (40) 31.1%
Netearnings 20 12.6% 60 12.0%
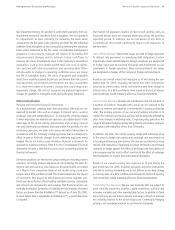
Gross Margin Progress
(% of sales)
2003 2004 2005
51.2
49.0
48%
49%
50%
51%
52%
51.0
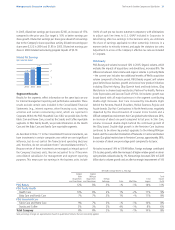
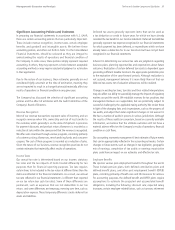
Net Sales
(in billions of dollars)
2003 2004 2005
51.4
43.4
56.7