Proctor and Gamble 2005 Annual Report Download - page 29
Download and view the complete annual report
Please find page 29 of the 2005 Proctor and Gamble annual report below. You can navigate through the pages in the report by either clicking on the pages listed below, or by using the keyword search tool below to find specific information within the annual report.-
 1
1 -
2
-
3
-
4
-
5
-
6
-
7
-
8
-
9
-
10
-
11
-
12
-
13
-
14
-
15
-
16
-
17
-
18
-
 19
19 -
 20
20 -
 21
21 -
 22
22 -
 23
23 -
 24
24 -
 25
25 -
 26
26 -
 27
27 -
 28
28 -
 29
29 -
 30
30 -
 31
31 -
 32
32 -
 33
33 -
 34
34 -
 35
35 -
 36
36 -
 37
37 -
 38
38 -
 39
39 -
40
-
41
-
42
-
43
-
44
-
45
-
46
-
47
-
48
-
49
-
50
-
51
-
52
-
53
-
54
-
55
-
56
-
57
-
58
-
59
-
60
-
61
-
62
-
63
-
64
-
65
-
66
-
67
-
68
-
69
-
70
-
71
-
72
 |
 |

Management’sDiscussionandAnalysis TheProcter&GambleCompanyandSubsidiaries 25
ThepurposeofthisdiscussionistoprovideanunderstandingofP&G’s
financialresultsandconditionbyfocusingonchangesincertainkey
measuresfromyeartoyear.Management’sDiscussionandAnalysis
(MD&A)isorganizedinthefollowingsections:
• OverviewoftheCompanyandsummaryofresultsforthefiscalyear
• Resultsofoperations
• Segmentresults
• Financialcondition
• Significantaccountingpoliciesandestimates
• Otherinformation
ThroughoutMD&A,werefertomeasuresusedbymanagementto
evaluateperformanceincludingunitvolumegrowth,netoutsidesales
andafter-taxprofit.Wealsorefertoorganicsalesgrowth(netsales
growthexcludingtheimpactsofacquisitions,divestituresandforeign
exchange),freecashflowandfreecashflowproductivity,whicharenot
definedunderaccountingprinciplesgenerallyacceptedintheUnited
StatesofAmerica(U.S.GAAP).Theexplanationofthesemeasures
attheendofMD&Aprovidesmoredetails.Managementalsouses
certainmarketshareestimatestoevaluateperformancerelativeto
competition–despitelimitationsontheavailabilityandcomparabilityof
shareinformation.ReferencestomarketshareinMD&Aarebasedona
combinationofvendor-reportedconsumptionandmarketsizedata,as
wellasinternalestimates.
Overview
P&G’sbusinessisfocusedonprovidingbrandedproductsofsuperior
qualityandvaluetoimprovethelivesoftheworld’sconsumers.We
believethiswillresultinleadershipsales,profitsandvaluecreation,
allowingemployees,shareholdersandthecommunitiesinwhichwe
operatetoprosper.
Procter&Gamblemarketsover300brandedproductsinmorethan
160countries.Wehaveoperationsinover80countriesthroughour
MarketDevelopmentOrganization(MDO).TheMDOincludesdedicated
retailcustomer,tradechannelandcountry-specificteamsthatworkto
buildourbrandsinlocalmarkets.Itisorganizedalongsevengeographic
areas:NorthAmerica,WesternEurope,NortheastAsia,LatinAmerica,
CentralandEasternEurope/MiddleEast/Africa,GreaterChinaand
ASEAN/Australasia/India.ThroughoutMD&A,wereferencebusiness
resultsindevelopingmarkets,whichwedefineastheaggregateof
LatinAmerica,CentralandEasternEurope/MiddleEast/Africa,Greater
ChinaandASEAN/Australasia/India.
Ourproductsaresoldprimarilythroughmassmerchandisers,grocery
stores,membershipclubstoresanddrugstores.Wehavealsoexpanded
ourpresencein“highfrequencystores,”theneighborhoodstoreswhich
servemanyconsumersindevelopingmarkets.
We compete in multiple product categories and have three
Global Business Units(GBUs):P&GBeauty,P&G FamilyHealth
andP&GHouseholdCare.Wemanageandreportbusinessand
financialresultsonthisbasis.EachGBUandtheMDOisledby
aViceChair,allofwhomreporttotheChiefExecutiveOfficer.
InJuly,2005wechangedthenamesoftheGBUs.BeautyCarewas
renamedP&GBeauty;Health,Baby&FamilyCarechangedtoP&G
FamilyHealth;andHouseholdCarewasrenamedP&GHouseholdCare.
Thesechangeshavenoimpactonthecompositionorhistoricalresults
oftheGBUs.
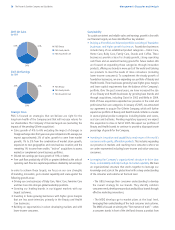
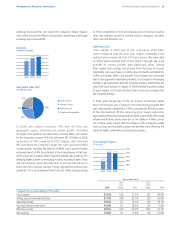
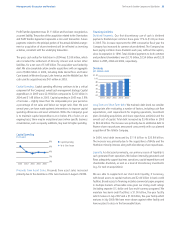
ThefollowingchartsprovidenetsalesandnetearningsbyGBUasa
percentageoftotalCompanyresults,excludingnetsalesandearnings
heldinCorporate,forthefiscalyearendedJune30,2005.Pleasesee
thediscussiononCorporateintheSegmentResultsdiscussionand
Note11totheConsolidatedFinancialStatementsformoreinformation.
Management’sDiscussionandAnalysis
Overview 25
ResultsofOperations 28
SegmentResults 31
FinancialCondition 34
SignificantAccountingPolicies
andEstimates 37
OtherInformation 39
AuditedConsolidatedFinancialStatements
Earnings 41
BalanceSheets 42
Shareholders’Equity 44
CashFlows 45
NotestoConsolidatedFinancialStatements 46
TableofContents
Management’sDiscussionandAnalysis