Proctor and Gamble 2005 Annual Report Download - page 57
Download and view the complete annual report
Please find page 57 of the 2005 Proctor and Gamble annual report below. You can navigate through the pages in the report by either clicking on the pages listed below, or by using the keyword search tool below to find specific information within the annual report.-
 1
1 -
2
-
3
-
4
-
5
-
6
-
7
-
8
-
9
-
10
-
11
-
12
-
13
-
14
-
15
-
16
-
17
-
18
-
19
-
20
-
21
-
22
-
23
-
24
-
25
-
26
-
27
-
28
-
29
-
30
-
31
-
32
-
33
-
34
-
35
-
36
-
37
-
38
-
39
-
40
-
41
-
42
-
43
-
44
-
45
-
46
-
 47
47 -
 48
48 -
 49
49 -
 50
50 -
 51
51 -
 52
52 -
 53
53 -
 54
54 -
 55
55 -
 56
56 -
 57
57 -
 58
58 -
 59
59 -
 60
60 -
 61
61 -
 62
62 -
 63
63 -
 64
64 -
 65
65 -
 66
66 -
 67
67 -
68
-
69
-
70
-
71
-
72
 |
 |

Management’sDiscussionandAnalysis TheProcter&GambleCompanyandSubsidiaries 53
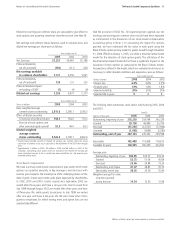
Dilutednetearningspercommonsharearecalculatedtogiveeffectto
stockoptionsandassumingconversionofpreferredstock(seeNote8).
Netearningsandcommonsharesbalancesusedtocalculatebasicand
dilutednetearningspersharewereasfollows:
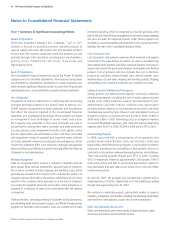
Stock-BasedCompensation
Wehaveaprimarystock-basedcompensationplanunderwhichstock
optionsaregrantedannuallytokeymanagersanddirectorswith
exercisepricesequaltothemarketpriceoftheunderlyingsharesonthe
dateofgrant.Grantsweremadeunderplansapprovedbyshareholders
in1992,2001and2003.GrantsissuedsinceSeptember2002are
vestedafterthreeyearsandhaveaten-yearlife.Grantsissuedfrom
July1998throughAugust2002arevestedafterthreeyearsandhave
afifteen-yearlife,whilegrantsissuedpriortoJuly1998arevested
afteroneyearandhaveaten-yearlife.Wealsomakeotherminor
grantstoemployees,forwhichvestingtermsandoptionlivesarenot
substantiallydifferent.
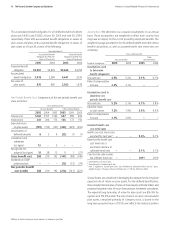
HadtheprovisionofSFASNo.123expensingbeenapplied,ournet
earningsandearningspercommonsharewouldhavebeenimpacted
assummarizedinthediscussionofourstock-basedcompensation
accountingpolicyinNote1.Incalculatingtheimpactforoptions
granted,wehaveestimatedthefairvalueofeachgrantusingthe
Black-Scholesoption-pricingmodelforgrantsissuedthroughDecember
31,2004.EffectiveJanuary1,2005,weutilizeabinomiallattice-based
modelforthevaluationofstockoptiongrants.Theutilizationofthe
binomiallattice-basedmodeldidnothaveasignificantimpactonthe
valuationofstockoptionsascomparedtotheBlack-Scholesmodel.
Assumptionsutilizedinthemodel,whichareevaluatedandrevised,as
necessary,toreflectmarketconditionsandexperience,wereasfollows:
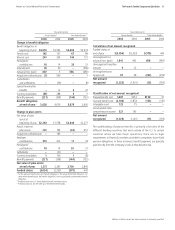
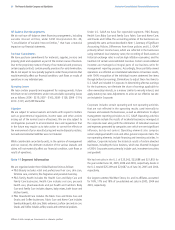
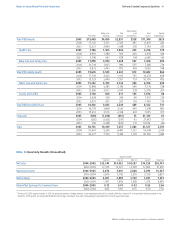
Thefollowingtablesummarizesstockoptionactivityduring2005,2004
and2003:
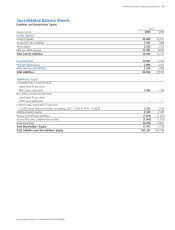
NotestoConsolidatedFinancialStatements TheProcter&GambleCompanyandSubsidiaries
Millionsofdollarsexceptpershareamountsorotherwisespecified.
YearsendedJune30
2004 2003
NetEarnings $6,481 $5,186
Preferreddividends,
netoftaxbenefit (131) (125)
6,3505,061
Preferreddividends,
netoftaxbenefit 131 125
Preferreddividendimpact
onfundingofESOP (4) (9)
6,477 5,177
YearsendedJune30
Sharesinmillions 2004 2003
Basicweightedaverage
commonsharesoutstanding 2,580.1 2,593.2
Effectofdilutivesecurities
Conversionofpreferredshares1 164.0 170.2
Exerciseofstockoptionsand
otherunvestedequityawards2 46.0 39.2
2,790.1 2,802.6
1 Despite being included currently in diluted net earnings per common share, the actual
conversiontocommonstockoccurspursuanttotherepaymentoftheESOPdebtthrough
2021.
2Approximately 1 million in 2005, 38 million in 2004 and 66 million in 2003 of the
Company’soutstandingstockoptionswerenotincludedinthediluted net earningsper
sharecalculation becausetodosowouldhave beenantidilutive(i.e.,theexerciseprice
exceededmarketvalue).
June30
OptionsinThousands 2004 2003
Outstanding,beginningofyear 259,598 240,326
Granted 40,866 35,759
Exercised (22,307) (13,904)
Canceled (1,864) (2,583)
276,293 259,598
Exercisable 151,828 118,202
Availableforgrant 165,399 203,593
Averageprice
Outstanding,beginningofyea
r $35.75 $33.34
Granted 51.06 45.68
Exercised 24.88 19.35
Outstanding,endofyear 38.85 35.75
Exercisable,endofyear 35.39 35.44
Weightedaveragefairvalue
ofoptionsgranted
duringtheyear 12.50 10.99
YearsendedJune30
OptionsGranted 2004 2003
Interestrate 3.8% 3.9%
Dividendyield 1.8% 1.8%
Expectedvolatility 20% 20%
Expectedlifeinyears 8 8