Proctor and Gamble 2005 Annual Report Download - page 35
Download and view the complete annual report
Please find page 35 of the 2005 Proctor and Gamble annual report below. You can navigate through the pages in the report by either clicking on the pages listed below, or by using the keyword search tool below to find specific information within the annual report.-
 1
1 -
2
-
3
-
4
-
5
-
6
-
7
-
8
-
9
-
10
-
11
-
12
-
13
-
14
-
15
-
16
-
17
-
18
-
19
-
20
-
21
-
22
-
23
-
24
-
 25
25 -
 26
26 -
 27
27 -
 28
28 -
 29
29 -
 30
30 -
 31
31 -
 32
32 -
 33
33 -
 34
34 -
 35
35 -
 36
36 -
 37
37 -
 38
38 -
 39
39 -
 40
40 -
 41
41 -
 42
42 -
 43
43 -
 44
44 -
 45
45 -
46
-
47
-
48
-
49
-
50
-
51
-
52
-
53
-
54
-
55
-
56
-
57
-
58
-
59
-
60
-
61
-
62
-
63
-
64
-
65
-
66
-
67
-
68
-
69
-
70
-
71
-
72
 |
 |
Management’sDiscussionandAnalysis TheProcter&GambleCompanyandSubsidiaries 31
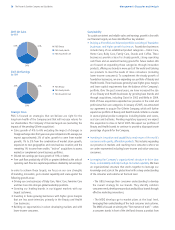
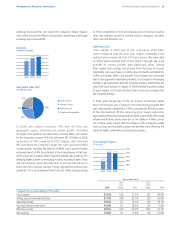
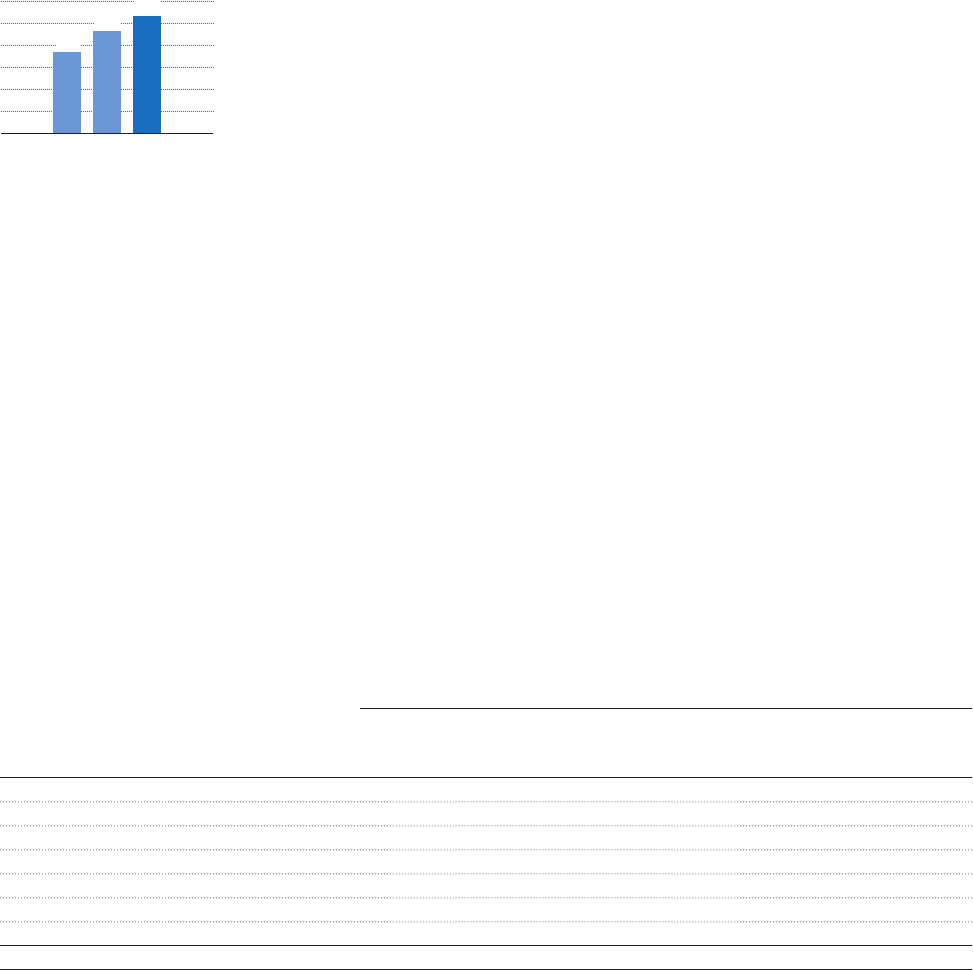
In2005,dilutednetearningspersharewere$2.66,anincreaseof15%
comparedtotheprioryear.Ourtargetis10%orbetterearningsper
sharegrowth.Dilutednetearningspersharegrewaheadofnetearnings
duetotheCompany’ssharerepurchaseactivity.Dilutednetearningsper
sharewere$2.32in2004and$1.85in2003.Dilutednetearningsper
sharein2003includedrestructuringprogramimpactsof$0.19.
SegmentResults
Resultsforthesegmentsreflectinformationonthesamebasisweuse
forinternalmanagementreportingandperformanceevaluation.These
resultsexcludecertaincostsincludedintheConsolidatedFinancial
Statements(e.g.,interestexpense,otherfinancingcosts,investing
activitiesandcertainrestructuringcosts),whicharereportedin
Corporate.WithintheP&GHouseholdCareGBU,weprovidedataforthe
FabricCareandHomeCare,aswellastheSnacksandCoffeereportable
segments.InP&GFamilyHealth,weprovideinformationontheHealth
CareandtheBabyCareandFamilyCarereportablesegments.
AsdescribedinNote11totheConsolidatedFinancialstatements,we
haveinvestmentsincertaincompaniesoverwhichweexertsignificant
influence,butdonotcontrolthefinancialandoperatingdecisions
and,therefore,donotconsolidatethem(“unconsolidatedentities”).
Becausecertainoftheseinvestmentsaremanagedasintegralpartsof
theCompany’sbusinessunits,theyareaccountedforasiftheywere
consolidatedsubsidiariesformanagementandsegmentreporting
purposes.Thismeanspre-taxearningsinthebusinessunitsinclude
100%ofeachpre-taxincomestatementcomponent,witheliminations
toadjustsuchlineitemstoU.S.GAAPincludedinCorporate.In
determiningafter-taxearningsinthebusinessunits,weeliminate
theshareofearningsapplicabletootherownershipinterests,ina
mannersimilartominorityinterest,andapplythestatutorytaxrates.
AdjustmentstoarriveattheCompany’seffectivetaxrateareincluded
inCorporate.
P&GBeauty
P&GBeautyunitvolumeincreased12%in2005.Organicvolume,which
excludestheimpactsofacquisitionsanddivestitures,increased8%.The
differencebetweentotalvolumeandorganicvolumeisprimarilyWella
–thecurrentyearincludestwoadditionalmonthsofWellaacquisition
volumecomparedtothebaseperiod.P&GBeautyorganicunitvolume
grewbehindbasebusinessgrowthandseveralnewproductinitiatives
includingOlayAnti-Aging,OlayQuenchhandandbodylotions,Olay
Moisturinsein-showerbodymoisturizer,PantenePro-Health,Pantene
ColorExpressionsandLacosteTouchofPink.Unitvolumegrowthwas
broad-basedwithallmajorbusinessesinthesegmentcontributing
double-digitincreases.HairCareincreasedbylow-doubledigits
behindthePantene,Head&Shoulders,HerbalEssences,Rejoiceand
Aussiebrands.OurHairCarebusinessinNorthAmericawasnegatively
impactedbythediscontinuationofseveralminorbrandsanda
difficultcompetitiveenvironment.HairCareglobalmarketsharewas24%,
anincreaseofaboutonepointcomparedtolastyear.InSkinCare,
volumeincreaseddouble-digitsbehindthecontinuedgrowthof
theOlaybrand.Double-digitgrowthintheFeminineCarebusiness
continuestobedrivenbyproductupgradestotheAlways/Whisper
brandsandthesuccessfulintroductionofNaturellainCentralandEastern
Europe.OurglobalmarketshareinFeminineCarewasapproximately36%,
anincreaseofaboutonepercentagepointcomparedtolastyear.
Netsalesincreased14%to$19.48billion.Foreignexchangecontributed
3%tosalesgrowth,whilethemiximpactofhigherrelativegrowthindevel-
opingmarketsreducedsalesby1%.Netearningsincreased22%to$2.85
billionduetovolumegrowthandanafter-taxmarginimprovementof100
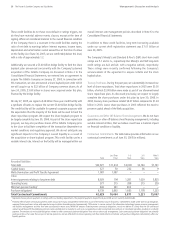
Diluted Net Earnings
(per common share)
2003 2004 2005
0
$3
2
1
1.85
2.32
2.66
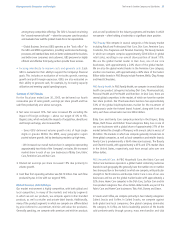
NetSalesChangeDriversvs.YearAgo
Volume Volume
With Without Total
Acquisitions Acquisitions Foreign Total Impact
andDivestitures andDivestitures Exchange Price Mix/Other Impact Ex-FX
P&GBeauty 12% 8% 3% –% -1% 14% 11%
P&GFamilyHealth
HealthCare 10% 8% 2% 1% -2% 11% 9%
BabyCareandFamilyCare7% 7% 3% 1% –% 11% 8%
P&GHouseholdCare
FabricCareandHomeCare9% 7% 2% –% -1% 10% 8%
SnacksandCoffee3% 3% 2% 4% -1% 8% 6%
8% 8% 2% 1% -1% 10% 8%
Salespercentagechangesareapproximationsbasedonquantitativeformulasthatareconsistentlyapplied.