Proctor and Gamble 2005 Annual Report Download - page 4
Download and view the complete annual report
Please find page 4 of the 2005 Proctor and Gamble annual report below. You can navigate through the pages in the report by either clicking on the pages listed below, or by using the keyword search tool below to find specific information within the annual report.-
 1
1 -
 2
2 -
 3
3 -
 4
4 -
 5
5 -
 6
6 -
 7
7 -
 8
8 -
 9
9 -
 10
10 -
 11
11 -
 12
12 -
 13
13 -
 14
14 -
 15
15 -
16
-
17
-
18
-
19
-
20
-
21
-
22
-
23
-
24
-
25
-
26
-
27
-
28
-
29
-
30
-
31
-
32
-
33
-
34
-
35
-
36
-
37
-
38
-
39
-
40
-
41
-
42
-
43
-
44
-
45
-
46
-
47
-
48
-
49
-
50
-
51
-
52
-
53
-
54
-
55
-
56
-
57
-
58
-
59
-
60
-
61
-
62
-
63
-
64
-
65
-
66
-
67
-
68
-
69
-
70
-
71
-
72
 |
 |
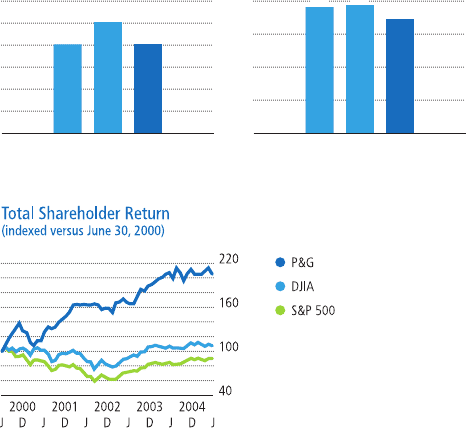
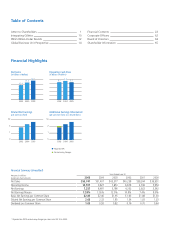
Organic Unit Volume Growth
(% increase versus previous year)
2004 20052003
8%
10%
8%
Free Cash Flow
(in billions of dollars)
2004 20052003
6.5
7.2 7.3
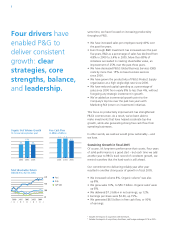
sametime,wehavefocusedonincreasingproductivity
throughoutP&G.
• Wehaveincreasedsalesperemployeenearly40%over
thepastfiveyears.
• EventhoughR&Dinvestmenthasincreasedoverthepast
fiveyears,R&Dasapercentageofsaleshasdeclinedfrom
4.8%in2000to3.4%in2005.Morethan80%of
initiativessucceededincreatingshareholdervalue,an
improvementof25%overthepastthreeyears.
• WehavedecreasedP&G’sGlobalBusinessServices(GBS)
costsbymorethan15%onbasebusinessservices
since2000.
• WehavegrowntheproductivityofP&G’sProductSupply
organizationatahighsingle-digitratesince2000.
• Wehavereducedcapitalspendingasapercentageof
salessince2000fromnearly8%tolessthan4%,without
foregoinganystrategicinvestmentingrowth.
• We’veaddedanincrementalgrowthpointtothe
Company’stoplineoverthepasttwoyearswith
MarketingROI(returnoninvestment)initiatives.
Thisfocusonproductivityimprovementhasstrengthened
P&G’scoststructure.Asaresult,we’vebeenableto
makeinvestmentsthathavehelpedacceleratetop-line
growth,whilealsogeneratingstrongfreecashflowfrom
operatingbusinesses.
Inotherwords,wesaidwewouldgrowsustainably–and
wehave.
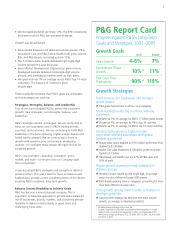
SustainingGrowthinFiscal2005
Ofcourse,it’slong-termperformancethatcounts.Fouryears
ofsolidperformanceisagoodstart–buteachtimeweadd
anotheryeartoP&G’strackrecordofconsistentgrowth,we
remindourselvesthatthehardworkisstillahead.
Ourcommitmenttodeliveringreliablyyearafteryear
resultedinanotherstrongyearofgrowthinfiscal2005.
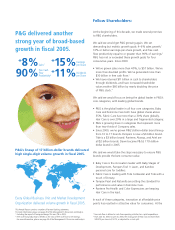
• Weincreasedvolume8%.Organicvolume5wasalso
up8%.
• Wegrewsales10%,to$56.7billion.Organicsales6were
up8%.
• Wedelivered$7.3billioninnetearnings,up12%.
• Earningspersharewere$2.66,up15%.
• Wegenerated$6.5billioninfreecashflow,or90%
ofearnings.
2
5 Excludestheimpactsofacquisitionsanddivestitures.
6 Excludestheimpactsofacquisitions,divestitures,andforeignexchangeof2%in2005.
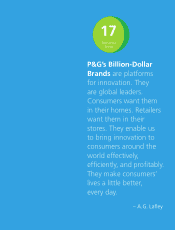
Fourdrivershave
enabledP&Gto
deliverconsistent
growth:clear
strategies,core
strengths,balance,
andleadership.