Proctor and Gamble 2005 Annual Report Download - page 60
Download and view the complete annual report
Please find page 60 of the 2005 Proctor and Gamble annual report below. You can navigate through the pages in the report by either clicking on the pages listed below, or by using the keyword search tool below to find specific information within the annual report.-
 1
1 -
2
-
3
-
4
-
5
-
6
-
7
-
8
-
9
-
10
-
11
-
12
-
13
-
14
-
15
-
16
-
17
-
18
-
19
-
20
-
21
-
22
-
23
-
24
-
25
-
26
-
27
-
28
-
29
-
30
-
31
-
32
-
33
-
34
-
35
-
36
-
37
-
38
-
39
-
40
-
41
-
42
-
43
-
44
-
45
-
46
-
47
-
48
-
49
-
 50
50 -
 51
51 -
 52
52 -
 53
53 -
 54
54 -
 55
55 -
 56
56 -
 57
57 -
 58
58 -
 59
59 -
 60
60 -
 61
61 -
 62
62 -
 63
63 -
 64
64 -
 65
65 -
 66
66 -
 67
67 -
 68
68 -
 69
69 -
 70
70 -
71
-
72
 |
 |

Management’sDiscussionandAnalysisTheProcter&GambleCompanyandSubsidiaries
56
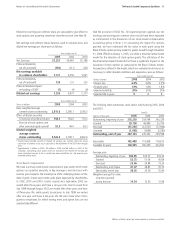
Theaccumulatedbenefitobligationforalldefinedbenefitretirement
planswas$4,610and$3,822atJune30,2005andJune30,2004,
respectively.Planswithaccumulatedbenefitobligationsinexcessof
planassetsandplanswithprojectedbenefitobligationsinexcessof
planassetsasofJune30,consistofthefollowing:
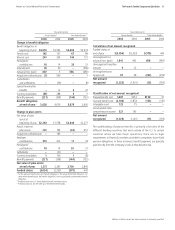
NetPeriodicBenefitCost.Componentsofthenetperiodicbenefitcost
wereasfollows:
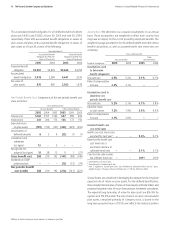
Assumptions.Wedetermineouractuarialassumptionsonanannual
basis.Theseassumptionsareweightedtoreflecteachcountrythat
mayhaveanimpactonthecostofprovidingretirementbenefits.The
weighted-averageassumptionsforthedefinedbenefitandotherretiree
benefitcalculations,aswellasassumedhealthcaretrendratesare
asfollows:
Severalfactorsareconsideredindevelopingtheestimateforthelong-term
expectedrateofreturnonplanassets.Forthedefinedbenefitplans,
theseincludehistoricalratesofreturnofbroadequityandbondindicesand
projectedlong-termratesofreturnfrompensioninvestmentconsultants.
Theexpectedlong-termratesofreturnforplanassetsare8%-9%for
equitiesand5%-6%bonds.Therateofreturnonotherretireebenefit
planassets,comprisedprimarilyofCompanystock,isbasedonthe
long-termprojectedreturnof9.5%andreflectsthehistoricalpattern
NotestoConsolidatedFinancialStatementsTheProcter&GambleCompanyandSubsidiaries
Millionsofdollarsexceptpershareamountsorotherwisespecified.
YearsendedJune30
PensionBenefits OtherRetireeBenefits
2004 2003 2004 2003
Servicecost $157 $124 $89 $62
Interestcost 204 173 172 150
Expectedreturn
onplanassets (153) (127) (329) (333)
Amortizationof
deferredamounts 3 4 (1) (1)
Curtailmentand
settlement
loss(gain) – 5 – –
Recognizednet
actuarialloss(gain) 28 13 1 (27)
239 192 (68) (149)
DividendsonESOP
preferredstock – – (73) (74)
239 192 (141) (223)
YearsendedJune30
Other
PensionBenefits RetireeBenefits
Actuarialassumptions 2004 2004
Assumptionsused
todetermine
benefitobligations1
Discountrate 5.2% 6.1%
Rateofcompensation
increase 3.1% –
Assumptionsusedto
determinenet
periodicbenefitcost2
Discountrate 5.1% 5.8%
Expectedreturn
onplanassets 7.4% 9.5%
Rateofcompensation
increase 3.0% –
Assumedhealthcare
costtrendrates
Healthcarecosttrendrates
assumedfornextyear3 – 9.7%
Ratethatthehealthcare
costtrendrateis
assumedtodeclineto
(ultimatetrendrate) – 5.1%
Yearthattheratereaches
theultimatetrendrate – 2010
1 Determinedasofendofyear.
2 Determinedasofbeginningofyear.
3 Rate is applied to current plan costs net of Medicare; estimated initial rate for“gross
eligiblecharges”(chargesinclusiveofMedicare)is7.7%for2005and2004.
YearsendedJune30
AccumulatedBenefit ProjectedBenefit
ObligationExceedsFair ObligationExceedsFair
ValueofPlanAssets ValueofPlanAssets
2004 2004
Projectedbenefit
obligation $2,809 $4,059
Accumulated
benefitobligation 2,396 3,320
Fairvalueof
planassets 638 1,676