Safeway 2001 Annual Report Download - page 10
Download and view the complete annual report
Please find page 10 of the 2001 Safeway annual report below. You can navigate through the pages in the report by either clicking on the pages listed below, or by using the keyword search tool below to find specific information within the annual report.-
 1
1 -
 2
2 -
 3
3 -
 4
4 -
 5
5 -
 6
6 -
 7
7 -
 8
8 -
 9
9 -
 10
10 -
 11
11 -
 12
12 -
 13
13 -
 14
14 -
 15
15 -
 16
16 -
 17
17 -
 18
18 -
 19
19 -
 20
20 -
 21
21 -
22
-
23
-
24
-
25
-
26
-
27
-
28
-
29
-
30
-
31
-
32
-
33
-
34
-
35
-
36
-
37
-
38
-
39
-
40
-
41
-
42
-
43
-
44
-
45
-
46
-
47
-
48
 |
 |

88
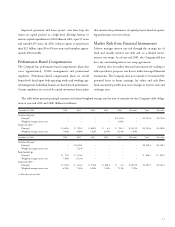
Increasing Sales We have led the supermarket industry
in same-store sales growth for seven of the last nine years. During 2001,
we recorded sales gains in continuing stores despite the sluggish econo-
my and overstoring in some markets. To sustain top-line growth, we
continue to focus on improving store-level execution, updating retail facili-
ties, offering new products and services, delivering exceptional value
and enhancing customer service.
Controlling Costs Operating and administrative
expense as a percentage of sales increased modestly in 2001. This follows
eight consecutive years of decline, after adjusting for acquisitions. While
we believe there are still opportunities for savings in O&A expense,
we expect to achieve proportionately greater savings going forward by
reducing our cost of goods. We plan to realize these savings primarily
from ongoing improvements in supply chain economics, better control
of product “shrink,” more effective promotions and continuing expansion
of private label brands.
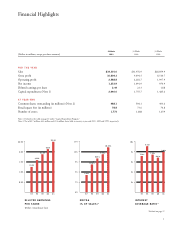
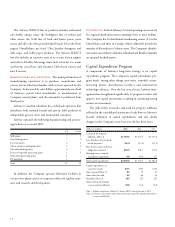
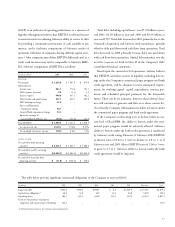
Managing Capital We increased capital spending to
$2.0 billion in 2001 from $1.8 billion the year before. During 2001 we
opened 95 new stores and expanded or remodeled 255 existing stores,
increasing total retail square footage by 7% (including the Genuardi’s
acquisition). Interest expense declined slightly, while our interest cov-
erage ratio remained a very strong 8.02 times despite additional debt
incurred to finance the Genuardi’s acquisition and to repurchase shares
of Safeway common stock.
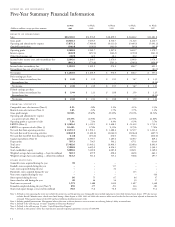
For the past nine years, Safeway consistently has ranked among the industry’s top
performers in same-store sales growth, cost reduction, working capital management,
operating cash flow margin expansion and earnings-per-share growth.* We have
achieved these results by focusing on the following three priorities:
*Based on latest available information
CAPITAL EXPENDITURES
(In billions)
97 98 99 00 01
1.0
.5
1.5
$2.0
$0.8
$1.2
$1.5
$1.8
$2.0
97 98 99 00* 01*
2.50%
3.75%
1.25%
5.00%
ANNUAL SAME-STORE
SALES GROWTH
Comparable-Store Sales Growth ■
Identical-Store Sales Growth ■
*Actual results have not been adjusted
to eliminate the estimated 50-basis-
point impact of the 2000 northern
California distribution center strike.
2.3% 2.3%
4.1%
2.2%
2.8%
Continued Performance