Safeway 2001 Annual Report Download - page 43
Download and view the complete annual report
Please find page 43 of the 2001 Safeway annual report below. You can navigate through the pages in the report by either clicking on the pages listed below, or by using the keyword search tool below to find specific information within the annual report.-
 1
1 -
2
-
3
-
4
-
5
-
6
-
7
-
8
-
9
-
10
-
11
-
12
-
13
-
14
-
15
-
16
-
17
-
18
-
19
-
20
-
21
-
22
-
23
-
24
-
25
-
26
-
27
-
28
-
29
-
30
-
31
-
32
-
 33
33 -
 34
34 -
 35
35 -
 36
36 -
 37
37 -
 38
38 -
 39
39 -
 40
40 -
 41
41 -
 42
42 -
 43
43 -
 44
44 -
 45
45 -
 46
46 -
 47
47 -
 48
48
 |
 |

41
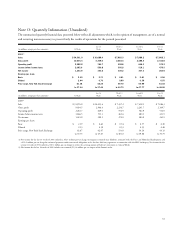
Note O: Quarterly Information (Unaudited)
The summarized quarterly financial data presented below reflect all adjustments which, in the opinion of management, are of a normal
and recurring nature necessary to present fairly the results of operations for the periods presented.
Last 16 Third 12 Second 12 First 12
(in millions, except per-share amounts) 52 Weeks Weeks Weeks Weeks Weeks
2001(1)
Sales $ 34,301.0 $10,686.4 $ 7,962.3 $ 7,986.2 $ 7,666.1
Gross profit 10,604.3 3,309.0 2,464.3 2,488.5 2,342.6
Operating profit 2,588.8 764.7 598.6 646.3 579.3
Income before income taxes 2,095.0 590.8 505.8 519.1 479.5
Net income 1,253.9 353.6 309.2 307.3 283.9
Earnings per share:
Basic $ 2.49 $ 0.71 $ 0.61 $ 0.61 $ 0.56
Diluted 2.44 0.70 0.60 0.59 0.55
Price range, New York Stock Exchange 61.38 46.25 49.70 55.99 61.38
to 37.44 to 37.44 to 40.75 to 47.77 to 46.06
Last 16 Third 12 Second 12 First 12
(in millions, except per-share amounts) 52 Weeks Weeks Weeks Weeks Weeks
2000(2)
Sales $ 31,976.9 $ 10,015.4 $ 7,457.2 $ 7,418.1 $ 7,086.3
Gross profit 9,494.5 2,946.4 2,236.7 2,201.7 2,109.7
Operating profit 2,281.7 629.0 554.9 582.9 514.9
Income before income taxes 1,866.5 511.3 461.6 480.1 413.5
Net income 1,091.9 299.1 270.0 280.9 241.9
Earnings per share:
Basic $ 2.19 $ 0.60 $ 0.54 $ 0.57 $ 0.49
Diluted 2.13 0.58 0.53 0.55 0.48
Price range, New York Stock Exchange 62.67 62.67 53.63 50.20 44.13
to 30.75 to 45.67 to 40.63 to 39.88 to 30.75
(1) Net income for the last 16 weeks of 2001 includes a $42.7 million pre-tax charge to recognize estimated lease liabilities associated with the Furr’s and Homeland bankruptcies and
a $51.0 million pre-tax charge for estimated payments under contractual obligations and a first loss deficiency agreement in connection with the FBO bankruptcy. Net income for the
second 12 weeks of 2001 includes a $30.1 million pre-tax charge to reduce the carrying amount of Safeway’s investment in GroceryWorks.
(2) Net income for the last 16 weeks of 2000 includes an estimated $113.8 million pre-tax impact of the Summit strike.