Safeway 2001 Annual Report Download - page 31
Download and view the complete annual report
Please find page 31 of the 2001 Safeway annual report below. You can navigate through the pages in the report by either clicking on the pages listed below, or by using the keyword search tool below to find specific information within the annual report.-
 1
1 -
2
-
3
-
4
-
5
-
6
-
7
-
8
-
9
-
10
-
11
-
12
-
13
-
14
-
15
-
16
-
17
-
18
-
19
-
20
-
 21
21 -
 22
22 -
 23
23 -
 24
24 -
 25
25 -
 26
26 -
 27
27 -
 28
28 -
 29
29 -
 30
30 -
 31
31 -
 32
32 -
 33
33 -
 34
34 -
 35
35 -
 36
36 -
 37
37 -
 38
38 -
 39
39 -
 40
40 -
 41
41 -
42
-
43
-
44
-
45
-
46
-
47
-
48
 |
 |

29
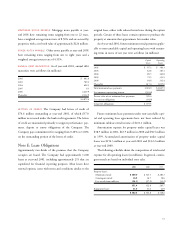
Note C: Store Closing
and Impairment Charges
IMPAIRMENT WRITE-DOWNS Safeway recognized impairment
charges of $6.7 million in 2001, $8.4 million in 2000 and $15.2
million in 1999 on the write-down of long-lived assets at stores
to be closed.
Below is a reconciliation of the number of owned stores that
the Company planned to close during 2001, 2000 and 1999:
2001 2000 1999
Beginning balance 911 10
Additional stores added during fiscal year 223
Reversals for stores that management
has determined will remain open (1) ––
Closures during fiscal year (7) (4) (2)
Ending balance 3911
Owned stores that the Company planned to close had aggre-
gate operating profits of $0.2 million in 2001, breakeven aggre-
gate operating results in 2000 and aggregate operating profits of
$3.0 million in 1999.
STORE LEASE EXIT COSTS: The reserve for store lease exit
costs includes the following activity for 2001, 2000 and 1999
(in millions):
2001 2000 1999
Beginning balance $ 144.6 $ 167.9 $ 117.8
Provision for estimated net future
cash flows(1) of additional stores
designated to be closed 10.1 7.1 4.8
Estimated net future cash flows(1)
of stores assumed through
acquisitions that are closed or
designated to be closed 6.5 3.6 77.4
Net cash flows, interest accretion,
changes in estimates of net
future cash flows (28.8) (31.0) (18.1)
Reversals of reserves for stores that
management has determined will
remain open –(3.0) (14.0)
Ending balance $132.4 $144.6 $ 167.9
(1) Estimated net future cash flows represents future minimum lease payments and related
ancillary costs from the date of closure to the end of the remaining lease term, net of
estimated cost recoveries that may be achieved through subletting properties or through
favorable lease terminations.
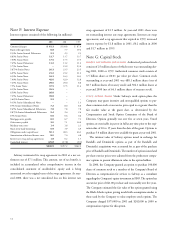
Note D: Financing
Notes and debentures were composed of the following at year-
end (in millions):
2001 2000
Commercial paper $ 1,723.8 $ 2,328.1
Bank credit agreement, unsecured –134.3
9.30% Senior Secured Debentures due 2007 24.3 24.3
6.85% Senior Notes due 2004, unsecured 200.0 200.0
7.00% Senior Notes due 2007, unsecured 250.0 250.0
7.45% Senior Debentures due 2027, unsecured 150.0 150.0
5.875% Senior Notes due 2001, unsecured –400.0
6.05% Senior Notes due 2003, unsecured 350.0 350.0
6.50% Senior Notes due 2008, unsecured 250.0 250.0
7.00% Senior Notes due 2002, unsecured 600.0 600.0
7.25% Senior Notes due 2004, unsecured 400.0 400.0
7.50% Senior Notes due 2009, unsecured 500.0 500.0
6.15% Senior Notes due 2006, unsecured 700.0 –
6.50% Senior Notes due 2011, unsecured 500.0 –
7.25% Senior Debentures due 2031, unsecured 600.0 –
3.625% Senior Notes due 2003, unsecured 400.0 –
10% Senior Subordinated Notes
due 2001, unsecured –79.9
9.65% Senior Subordinated Debentures
due 2004, unsecured 81.2 81.2
9.875% Senior Subordinated Debentures
due 2007, unsecured 24.2 24.2
10% Senior Notes due 2002, unsecured 6.1 6.1
Mortgage notes payable, secured 64.0 76.7
Other notes payable, unsecured 31.7 86.8
Medium-term notes, unsecured 16.5 16.5
Short-term bank borrowings, unsecured 7.6 75.0
6,879.4 6,033.1
Less current maturities (642.6) (626.8)
Long-term portion $ 6,236.8 $ 5,406.3