Safeway 2001 Annual Report Download - page 13
Download and view the complete annual report
Please find page 13 of the 2001 Safeway annual report below. You can navigate through the pages in the report by either clicking on the pages listed below, or by using the keyword search tool below to find specific information within the annual report.-
 1
1 -
2
-
 3
3 -
 4
4 -
 5
5 -
 6
6 -
 7
7 -
 8
8 -
 9
9 -
 10
10 -
 11
11 -
 12
12 -
 13
13 -
 14
14 -
 15
15 -
 16
16 -
 17
17 -
 18
18 -
 19
19 -
 20
20 -
 21
21 -
 22
22 -
 23
23 -
24
-
25
-
26
-
27
-
28
-
29
-
30
-
31
-
32
-
33
-
34
-
35
-
36
-
37
-
38
-
39
-
40
-
41
-
42
-
43
-
44
-
45
-
46
-
47
-
48
 |
 |

11
Improved operations and lower project costs have kept the
return on capital projects at a high level, allowing Safeway to
increase capital expenditures to $2.0 billion in 2001, open 95 stores
and remodel 255 stores. In 2002, Safeway expects to spend more
than $2.1 billion, open 80 to 85 new stores and complete approx-
imately 250 remodels.
Performance-Based Compensation
The Company has performance-based compensation plans that
cover approximately 19,000 management and professional
employees. Performance-based compensation plans set overall
bonus levels based upon both operating results and working capi-
tal management. Individual bonuses are based on job performance.
Certain employees are covered by capital investment bonus plans
that measure the performance of capital projects based on operat-
ing performance over several years.
Market Risk from Financial Instruments
Safeway manages interest rate risk through the strategic use of
fixed and variable interest rate debt and, to a limited extent,
interest rate swaps. As of year-end 2001, the Company did not
have any outstanding interest rate swap agreements.
Safeway does not utilize financial instruments for trading or
other speculative purposes, nor does it utilize leveraged financial
instruments. The Company does not consider to be material the
potential losses in future earnings, fair values and cash flows
from reasonably possible near-term changes in interest rates and
exchange rates.
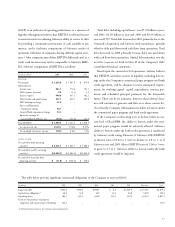
The table below presents principal amounts and related weighted average rates by year of maturity for the Company’s debt obliga-
tions at year-end 2001 and 2000 (dollars in millions):
December 29, 2001 2002 2003 2004 2005 2006 Thereafter Total Fair value
Commercial paper:
Principal ––––$1,723.8 – $ 1,723.8 $1,723.8
Weighted average interest rate ––––3.49% –
Long-term debt:(1)
Principal $ 642.6 $ 789.2 $ 698.5 $ 6.3 $ 706.1 $ 2,312.9 $ 5,155.6 $5,382.8
Weighted average interest rate 7.00% 4.88% 7.42% 6.05% 6.14% 7.09%
December 30, 2000 2001 2002 2003 2004 2005 Thereafter Total Fair value
Commercial paper:
Principal – $2,328.1 ––––$ 2,328.1 $2,328.1
Weighted average interest rate –7.21% ––––
Bank borrowings:
Principal $ 75.0 $ 134.3 ––––$ 209.3 $ 209.3
Weighted average interest rate 7.18% 6.13% ––––
Long-term debt:(1)
Principal $ 551.8 $ 641.2 $ 378.6 $ 698.6 $ 6.5 $ 1,219.0 $ 3,495.7 $3,544.3
Weighted average interest rate 6.76% 7.03% 6.20% 7.42% 7.11% 7.25%
(1) Primarily fixed-rate debt