Safeway 2001 Annual Report Download - page 36
Download and view the complete annual report
Please find page 36 of the 2001 Safeway annual report below. You can navigate through the pages in the report by either clicking on the pages listed below, or by using the keyword search tool below to find specific information within the annual report.-
 1
1 -
2
-
3
-
4
-
5
-
6
-
7
-
8
-
9
-
10
-
11
-
12
-
13
-
14
-
15
-
16
-
17
-
18
-
19
-
20
-
21
-
22
-
23
-
24
-
25
-
 26
26 -
 27
27 -
 28
28 -
 29
29 -
 30
30 -
 31
31 -
 32
32 -
 33
33 -
 34
34 -
 35
35 -
 36
36 -
 37
37 -
 38
38 -
 39
39 -
 40
40 -
 41
41 -
 42
42 -
 43
43 -
 44
44 -
 45
45 -
 46
46 -
47
-
48
 |
 |

34
ADDITIONAL STOCK PLAN INFORMATION The Company accounts
for its stock-based awards using the intrinsic value method in
accordance with Accounting Principles Board Opinion No. 25,
“Accounting for Stock Issued to Employees,” and its related
interpretations. Accordingly, no compensation expense has been
recognized in the financial statements for employee stock option
awards granted at fair market value.
SFAS No. 123, “Accounting for Stock-Based Compensation,”
requires the disclosure of pro forma net income and earnings per
share as if the Company had adopted the fair value method as of
the beginning of fiscal 1995. Under SFAS No. 123, the fair value
of stock-based awards to employees is calculated through the use
of option pricing models, even though such models were devel-
oped to estimate the fair value of freely tradable, fully transfer-
able options without vesting restrictions, which significantly
differ from the Company’s stock option awards. These models
also require subjective assumptions, including future stock price
volatility and expected time to exercise, which greatly affect the
calculated values. The Company’s calculations were made using
the Black-Scholes option pricing model with the following
weighted average assumptions: seven to nine years expected life;
stock volatility of 34% in 2001 and 2000 and 31% in 1999;
risk-free interest rates of 4.86% in 2001, 6.16% in 2000 and
5.79% in 1999; and no dividends during the expected term.
The Company’s calculations are based on a single-option val-
uation approach and forfeitures are recognized as they occur.
However, the impact of outstanding unvested stock options
granted prior to 1995 has been excluded from the pro forma cal-
culation; accordingly, the pro forma results presented below are
not indicative of future-period pro forma results. Had compen-
sation cost for Safeway’s stock option plans been determined
based on the fair value at the grant date for awards from 1996
through 2001, consistent with the provisions of SFAS No. 123,
the Company’s net income and earnings per share would have
been reduced to the pro forma amounts indicated below:
2001 2000 1999
Net income (in millions):
As reported $ 1,253.9 $1,091.9 $ 970.9
Pro forma 1,208.9 1,061.5 951.5
Basic earnings per share:
As reported $2.49 $ 2.19 $ 1.95
Pro forma 2.40 2.13 1.91
Diluted earnings per share:
As reported $2.44 $ 2.13 $ 1.88
Pro forma 2.36 2.07 1.85
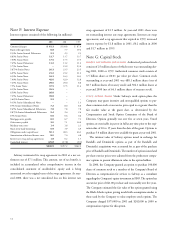
The following table summarizes stock option information at year-end 2001:
Options Outstanding Options Exercisable
■■■■■■■■■ ■■■■■■■■■
Range of Number Weighted-Average Weighted-Average Number Weighted-Average
Exercise Prices of Options Remaining Contractual Life Exercise Price of Options Exercise Price
■■■■■■■■■ ■■■■■■■■■
$ 1.57 to $ 3.22 4,217,997 5.15 years $ 2.90 4,217,997 $ 2.90
3.25 to 6.56 5,202,296 3.21 5.61 5,102,296 5.59
6.59 to 18.94 4,607,025 4.30 11.26 3,732,327 11.08
20.08 to 31.44 4,229,896 6.03 27.46 1,787,249 26.60
32.31 to 40.06 4,876,914 7.40 36.30 1,194,570 36.91
40.50 to 43.81 5,201,966 7.91 42.25 1,257,660 42.05
44.00 to 51.00 5,329,180 8.85 49.30 571,208 48.84
51.23 to 62.50 4,981,607 8.44 55.24 895,309 55.18
■■■■■■■■■■■■■■■■■■■■■■■■■■■■■■■■■■■■■■■■■■■■■■■■■■■■■■■■■■■■■■■■■■■■
1.57 to 62.50 38,646,881 6.47 29.61 18,758,616 16.20
■■■■■■■■■■■■■■■■■■■■■■■■■■■■■■■■■■■■■■■■■■■■■■■■■■■■■■■■■■■■■■■■■■■■