Safeway 2001 Annual Report Download - page 3
Download and view the complete annual report
Please find page 3 of the 2001 Safeway annual report below. You can navigate through the pages in the report by either clicking on the pages listed below, or by using the keyword search tool below to find specific information within the annual report.-
 1
1 -
 2
2 -
 3
3 -
 4
4 -
 5
5 -
 6
6 -
 7
7 -
 8
8 -
 9
9 -
 10
10 -
 11
11 -
 12
12 -
 13
13 -
 14
14 -
15
-
16
-
17
-
18
-
19
-
20
-
21
-
22
-
23
-
24
-
25
-
26
-
27
-
28
-
29
-
30
-
31
-
32
-
33
-
34
-
35
-
36
-
37
-
38
-
39
-
40
-
41
-
42
-
43
-
44
-
45
-
46
-
47
-
48
 |
 |
1
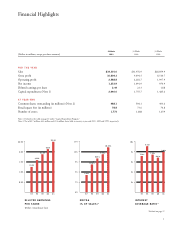
FOR THE YEAR
Sales $34,301.0 $31,976.9 $28,859.9
Gross profit 10,604.3 9,494.5 8,510.7
Operating profit 2,588.8 2,281.7 1,997.9
Net income 1,253.9 1,091.9 970.9
Diluted earnings per share 2.44 2.13 1.88
Capital expenditures (Note 1) 2,040.0 1,755.7 1,485.6
AT YEAR-END
Common shares outstanding (in millions) (Note 2) 488.1 504.1 493.6
Retail square feet (in millions) 78.8 73.6 70.8
Number of stores 1,773 1,688 1,659
Note 1: Defined in the table on page 10 under “Capital Expenditure Program.”
Note 2: Net of 82.7 million, 64.3 million and 65.4 million shares held in treasury at year-end 2001, 2000 and 1999, respectively.
52 Weeks 52 Weeks 52 Weeks
(Dollars in millions, except per-share amounts) 2001 2000 1999
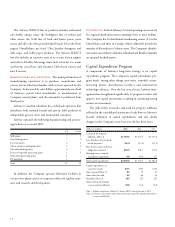
97 98 99 00 01
$1.25
$1.59
$1.88
$2.13
$2.44
2.00
$2.50
1.50
1.00
0.50
DILUTED EARNINGS
PER SHARE
(Before extraordinary loss)
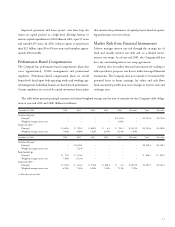
97 98 99 00 01
7.18x
9.11x
7.45x
6.83x
8.02x
8x
10x
6x
4x
2x
INTEREST
COVERAGE RATIO*
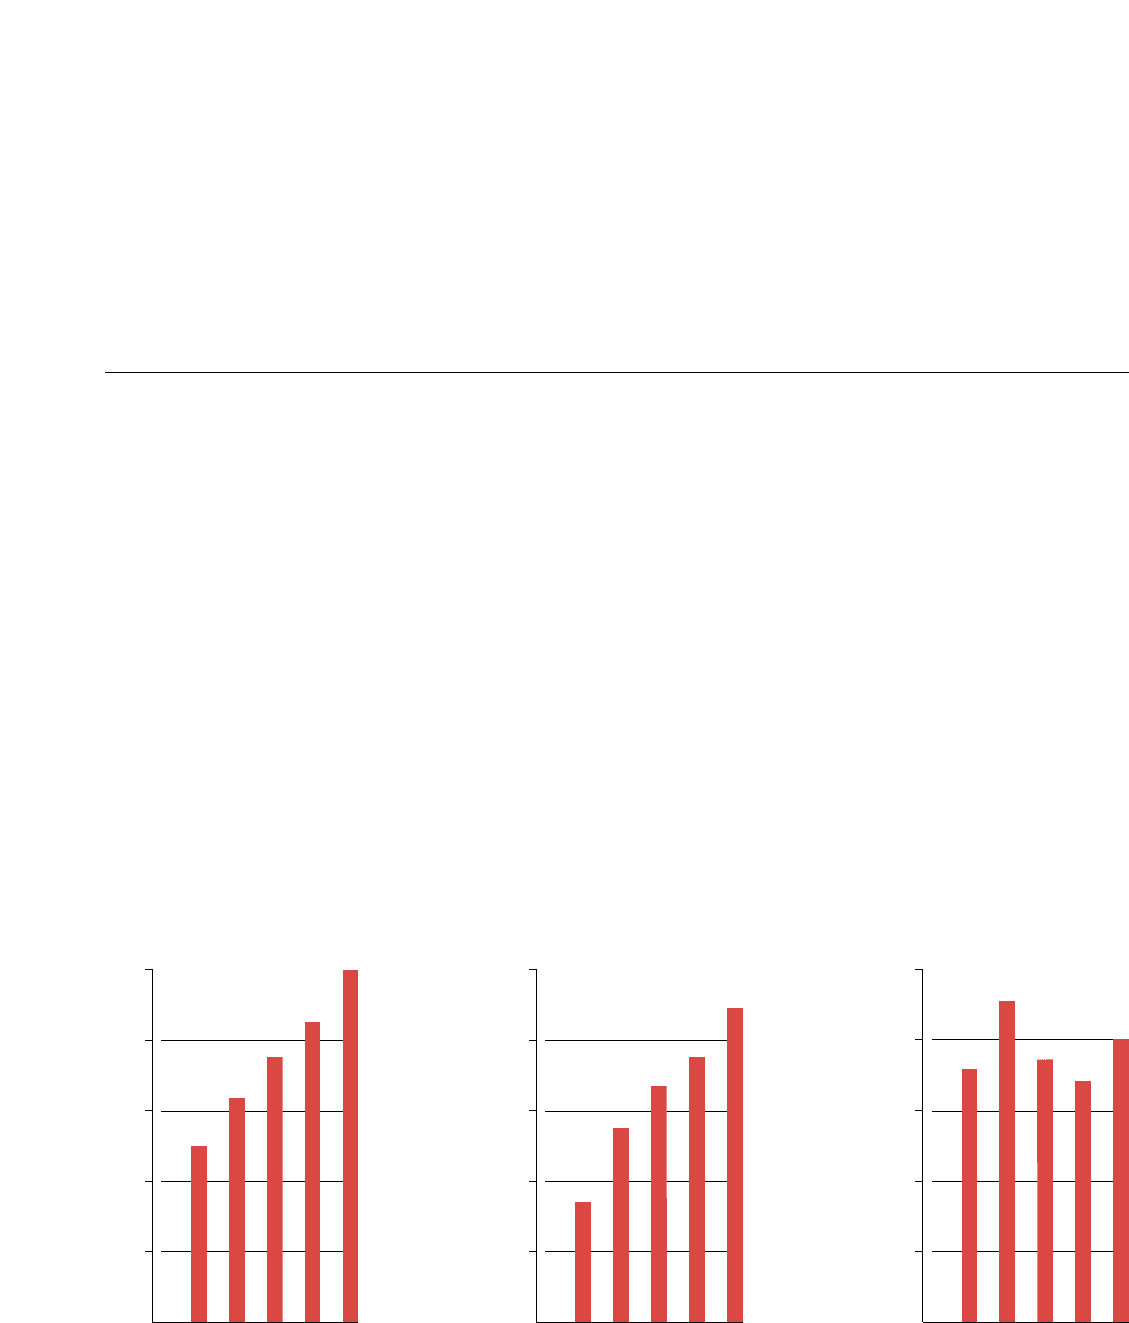
97 98 99 00 01
7. 7 0 %
8.75%
9.35%
10. 45 %
9.76%
10%
11%
9%
8%
7%
6%
EBITDA
(% OF SALES)*
Financial Highlights
* Defined on page 17