Safeway 2001 Annual Report Download - page 14
Download and view the complete annual report
Please find page 14 of the 2001 Safeway annual report below. You can navigate through the pages in the report by either clicking on the pages listed below, or by using the keyword search tool below to find specific information within the annual report.-
 1
1 -
2
-
3
-
 4
4 -
 5
5 -
 6
6 -
 7
7 -
 8
8 -
 9
9 -
 10
10 -
 11
11 -
 12
12 -
 13
13 -
 14
14 -
 15
15 -
 16
16 -
 17
17 -
 18
18 -
 19
19 -
 20
20 -
 21
21 -
 22
22 -
 23
23 -
 24
24 -
25
-
26
-
27
-
28
-
29
-
30
-
31
-
32
-
33
-
34
-
35
-
36
-
37
-
38
-
39
-
40
-
41
-
42
-
43
-
44
-
45
-
46
-
47
-
48
 |
 |

12
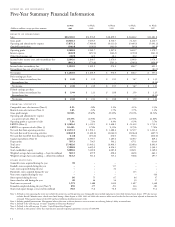
SAFEWAY INC. AND SUBSIDIARIES
Five-Year Summary Financial Information
52 Weeks 52 Weeks 52 Weeks 52 Weeks 53 Weeks
(Dollars in millions, except per-share amounts) 2001 2000 1999 1998 1997
RESULTS OF OPERATIONS
Sales $34,301.0 $31,976.9 $ 28,859.9 $ 24,484.2 $ 22,483.8
Gross profit 10,604.3 9,494.5 8,510.7 7,124.5 6,414.7
Operating and administrative expense (7,875.1) (7,086.6) (6,411.4) (5,466.5) (5,093.2)
Goodwill amortization (140.4) (126.2) (101.4) (56.3) (41.8)
Operating profit 2,588.8 2,281.7 1,997.9 1,601.7 1,279.7
Interest expense (446.9) (457.2) (362.2) (235.0) (241.2)
Other (loss) income, net (46.9) 42.0 38.3 30.2 37.8
Income before income taxes and extraordinary loss 2,095.0 1,866.5 1,674.0 1,396.9 1,076.3
Income taxes (841.1) (774.6) (703.1) (590.2) (454.8)
Income before extraordinary loss 1,253.9 1,091.9 970.9 806.7 621.5
Extraordinary loss, net of tax benefit of $41.1 ––––(64.1)
Net income $ 1,253.9 $ 1,091.9 $ 970.9 $ 806.7 $ 557.4
Basic earnings per share:
Income before extraordinary loss $2.49 $ 2.19 $ 1.95 $ 1.67 $ 1.35
Extraordinary loss ––––(0.14)
Net income $2.49 $ 2.19 $ 1.95 $ 1.67 $ 1.21
Diluted earnings per share:
Income before extraordinary loss $2.44 $ 2.13 $ 1.88 $ 1.59 $ 1.25
Extraordinary loss ––––(0.13)
Net income $2.44 $ 2.13 $ 1.88 $ 1.59 $ 1.12
FINANCIAL STATISTICS
Comparable-store sales increases (Note 1) 2.3% 2.8% 2.2% 4.1% 2.3%
Identical-store sales increases (Note 1) 1.6% 2.2% 1.7% 3.7% 1.3%
Gross profit margin 30.92% 29.69% 29.49% 29.10% 28.53%
Operating and administrative expense
as a percent of sales (Note 2) 23.37% 22.56% 22.57% 22.56% 22.84%
Operating profit as a percent of sales 7.5% 7.1% 6.9% 6.5% 5.7%
EBITDA (Note 3) $ 3,585.4 $ 3,122.1 $ 2,698.5 $ 2,141.9 $ 1,732.3
EBITDA as a percent of sales (Note 3) 10.45% 9.76% 9.35% 8.75% 7.70%
Net cash flow from operating activities $ 2,231.3 $ 1,901.1 $ 1,488.4 $ 1,252.7 $ 1,221.6
Net cash flow used by investing activities (2,242.3) (1,481.0) (2,064.3) (2,186.4) (607.7)
Net cash flow (used by) from financing activities (11.8) (434.4) 636.0 903.4 (614.6)
Capital expenditures (Note 4) 2,040.0 1,755.7 1,485.6 1,189.7 829.4
Depreciation 797.3 704.5 594.2 475.1 414.0
Total assets 17,462.6 15,965.2 14,900.3 11,389.6 8,493.9
Total debt 7,399.8 6,495.9 6,956.3 4,972.1 3,340.3
Total stockholders’ equity 5,889.6 5,389.8 4,085.8 3,082.1 2,149.0
Weighted average shares outstanding — basic (in millions) 503.3 497.9 498.6 482.8 462.3
Weighted average shares outstanding — diluted (in millions) 513.2 511.6 515.4 508.8 497.7
OTHER STATISTICS
Genuardi’s stores acquired during the year 39 ––––
Randall’s stores acquired during the year ––117 ––
Carrs stores acquired during the year ––32 ––
Dominick’s stores acquired during the year –––113 –
Vons stores acquired during the year ––––316
Stores opened during the year 95 75 67 46 37
Stores closed or sold during the year 49 46 54 30 37
Total stores at year-end 1,773 1,688 1,659 1,497 1,368
Remodels completed during the year (Note 5) 255 275 251 234 181
Total retail square footage at year-end (in millions) 78.8 73.6 70.8 61.6 53.2
Note 1. Defined as stores operating the entire year in both the current year and the previous year. Comparable stores include replacement stores while identical stores do not. 1997 sales increase
excludes British Columbia stores, which were closed during a labor dispute in 1996. 2001 and 2000 sales increases reflect actual results that have not been adjusted to eliminate the
estimated 50-basis-point impact of the 2000 northern California distribution center strike.
Note 2. Includes goodwill amortization. Management believes this ratio is relevant because it assists investors in evaluating Safeway’s ability to control costs.
Note 3. Defined in the table on page 17 under “Liquidity and Financial Resources”.
Note 4. Defined in the table on page 10 under “Capital Expenditure Program”.
Note 5. Defined as store projects (other than maintenance) generally requiring expenditures in excess of $200,000.