Safeway 2001 Annual Report Download - page 42
Download and view the complete annual report
Please find page 42 of the 2001 Safeway annual report below. You can navigate through the pages in the report by either clicking on the pages listed below, or by using the keyword search tool below to find specific information within the annual report.-
 1
1 -
2
-
3
-
4
-
5
-
6
-
7
-
8
-
9
-
10
-
11
-
12
-
13
-
14
-
15
-
16
-
17
-
18
-
19
-
20
-
21
-
22
-
23
-
24
-
25
-
26
-
27
-
28
-
29
-
30
-
31
-
 32
32 -
 33
33 -
 34
34 -
 35
35 -
 36
36 -
 37
37 -
 38
38 -
 39
39 -
 40
40 -
 41
41 -
 42
42 -
 43
43 -
 44
44 -
 45
45 -
 46
46 -
 47
47 -
 48
48
 |
 |

40
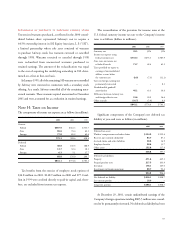
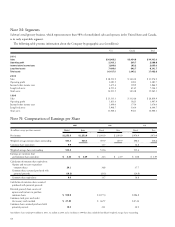
Note M: Segments
Safeway’s retail grocery business, which represents more than 98% of consolidated sales and operates in the United States and Canada,
is its only reportable segment.
The following table presents information about the Company by geographic area (in millions):
U.S. Canada Total
2001
Sales $30,866.2 $3,434.8 $34,301.0
Operating profit 2,383.1 205.7 2,588.8
Income before income taxes 1,899.8 195.2 2,095.0
Long-lived assets 7,499.0 642.7 8,141.7
Total assets 16,417.5 1,045.1 17,462.6
2000
Sales $ 28,533.9 $ 3,443.0 $ 31,976.9
Operating profit 2,081.5 200.2 2,281.7
Income before income taxes 1,675.6 190.9 1,866.5
Long-lived assets 6,531.6 614.5 7,146.1
Total assets 14,931.5 1,033.8 15,965.3
1999
Sales $ 25,535.3 $ 3,324.6 $ 28,859.9
Operating profit 1,815.4 182.5 1,997.9
Income before income taxes 1,499.0 175.0 1,674.0
Long-lived assets 5,908.7 536.0 6,444.7
Total assets 13,960.2 940.1 14,900.3
Note N: Computation of Earnings per Share
2001 2000 1999
(In millions, except per-share amounts) Diluted Basic Diluted Basic Diluted Basic
■■■■■■■■ ■■■■■■■■■■■■■■■■■■■ ■■■■■■■■■■■■■■■
Net income $1,253.9 $1,253.9 $1,091.9 $1,091.9 $ 970.9 $ 970.9
Weighted average common shares outstanding 503.3 503.3 497.9 497.9 498.6 498.6
■■■■■■■■■■■■■■■■■■■■■■■■■■■■■■■■■■■■■■■■■■■■■■■■■■■■■
Common share equivalents 9.9 13.7 16.8
Weighted average shares outstanding 513.2 511.6 515.4
Earnings per common share
and common share equivalent: $ 2.44 $ 2.49 $ 2.13 $ 2.19 $ 1.88 $ 1.95
Calculation of common share equivalents:
Options and warrants to purchase
common shares 29.1 36.8 37.7
Common shares assumed purchased with
potential proceeds (19.2) (23.1) (20.9)
Common share equivalents 9.9 13.7 16.8
Calculation of common shares assumed
purchased with potential proceeds:
Potential proceeds from exercise of
options and warrants to purchase
common shares $ 918.9 $1,077.4 $ 986.8
Common stock price used under
the treasury stock method $ 47.85 $ 46.57 $ 47.26
Common shares assumed purchased with
potential proceeds 19.2 23.1 20.9
Anti-dilutive shares totaling 9.0 million in 2001, 3.2 million in 2000 and 2.4 million in 1999 have been excluded from diluted weighted average shares outstanding.