Siemens 2006 Annual Report Download - page 115
Download and view the complete annual report
Please find page 115 of the 2006 Siemens annual report below. You can navigate through the pages in the report by either clicking on the pages listed below, or by using the keyword search tool below to find specific information within the annual report.-
 1
1 -
2
-
3
-
4
-
5
-
6
-
7
-
8
-
9
-
10
-
11
-
12
-
13
-
14
-
15
-
16
-
17
-
18
-
19
-
20
-
21
-
22
-
23
-
24
-
25
-
26
-
27
-
28
-
29
-
30
-
31
-
32
-
33
-
34
-
35
-
36
-
37
-
38
-
39
-
40
-
41
-
42
-
43
-
44
-
45
-
46
-
47
-
48
-
49
-
50
-
51
-
52
-
53
-
54
-
55
-
56
-
57
-
58
-
59
-
60
-
61
-
62
-
63
-
64
-
65
-
66
-
67
-
68
-
69
-
70
-
71
-
72
-
73
-
74
-
75
-
76
-
77
-
78
-
79
-
80
-
81
-
82
-
83
-
84
-
85
-
86
-
87
-
88
-
89
-
90
-
91
-
92
-
93
-
94
-
95
-
96
-
97
-
98
-
99
-
100
-
101
-
102
-
103
-
104
-
 105
105 -
 106
106 -
 107
107 -
 108
108 -
 109
109 -
 110
110 -
 111
111 -
 112
112 -
 113
113 -
 114
114 -
 115
115 -
 116
116 -
 117
117 -
 118
118 -
 119
119 -
 120
120 -
 121
121 -
 122
122 -
 123
123 -
 124
124 -
 125
125 -
126
-
127
-
128
-
129
-
130
-
131
-
132
-
133
-
134
-
135
-
136
-
137
-
138
-
139
-
140
-
141
-
142
-
143
-
144
-
145
-
146
-
147
-
148
-
149
-
150
-
151
-
152
-
153
-
154
-
155
-
156
-
157
-
158
-
159
-
160
-
161
-
162
-
163
-
164
-
165
-
166
-
167
-
168
-
169
-
170
-
171
-
172
-
173
-
174
-
175
-
176
-
177
-
178
-
179
-
180
-
181
-
182
-
183
-
184
-
185
-
186
-
187
-
188
-
189
-
190
-
191
-
192
-
193
-
194
-
195
-
196
-
197
-
198
-
199
-
200
-
201
-
202
-
203
-
204
-
205
-
206
-
207
-
208
-
209
-
210
-
211
-
212
-
213
-
214
-
215
-
216
-
217
-
218
-
219
-
220
-
221
-
222
-
223
-
224
-
225
-
226
-
227
-
228
-
229
-
230
-
231
-
232
-
233
-
234
-
235
-
236
-
237
-
238
-
239
-
240
-
241
-
242
-
243
-
244
-
245
-
246
-
247
-
248
-
249
-
250
-
251
-
252
-
253
-
254
-
255
-
256
-
257
-
258
-
259
-
260
 |
 |

Management’s discussion and analysis 111
Power
Power Generation (PG)
A combination of focused acquisitions and robust organic growth, particularly in the fossil
power generation business, generated a 25% increase in sales year-over-year, to €10.086 bil-
lion. Orders of €12.532 billion were up 14% compared to fiscal 2005, including a very large
fossil power generation contract in the Middle East. The wind power business significantly
increased its earnings and profit margin, and won two large contracts in the U.S. that nearly
tripled orders year-over-year. Sales and orders for the year also include the acquisition of
Wheelabrator, a provider of emissions reduction technology for the energy industry. PG’s fossil
power generation business saw a significant decline in earnings in fiscal 2006, due in part to
the bankruptcy of a consortium partner and charges related to major projects. In addition,
equity earnings from PG’s stake in a European joint venture declined by €106 million and
turned negative. These factors limited Group profit for PG overall to €782 million compared to
€951 million a year earlier. While PG expects its earnings margin to return to the target range
in fiscal 2007, the earnings volatility of equity investments could continue to affect the Group’s
profitability. On a long-term basis, margins at PG may also reflect continued growth in the
fields of industrial applications and wind energy, where profitability is rising from below the
level of PG’s fossil power generation business.
Power Transmission and Distribution (PTD)
In fiscal 2006, PTD recorded rapid growth in Group profit, sales and orders in a strong
global market for secure, high-efficiency power transmission and distribution. Group profit
rose 84%, to €390 million for the year, as PTD leveraged improved operating performance into
a much larger revenue base resulting from its portion of the VA Tech acquisition. For com-
parison, the prior year included charges related to a project in the CIS and charges for capacity
adjustments at a transformer facility in Germany. Sales rose 53%, to €6.509 billion, and
orders increased 52%, to €8.028 billion, on a balance of Group-wide organic growth and
acquired volume.
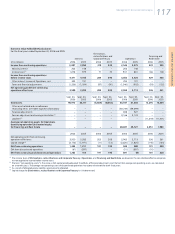
Management’s discussion and analysis
Year ended September 30,
% Change
(€ in millions) 2006 2005 Actual Adjusted*
Group profit 782 951 (18)%
Group profit margin 7.8% 11.8%
Sales 10,086 8,061 25% 19%
New orders 12,532 10,964 14% 5%
* Excluding currency translation effects of 1% on sales and orders, and portfolio effects of 5% and 8% on sales and
orders, respectively.
Year ended September 30,
% Change
(€ in millions) 2006 2005 Actual Adjusted*
Group profit 390 212 84%
Group profit margin 6.0% 5.0%
Sales 6,509 4,250 53% 27%
New orders 8,028 5,283 52% 29%
* Excluding currency translation effects of 3% and 4% on sales and orders, respectively, and portfolio effects
of 23% and 19% on sales and orders, respectively.