Siemens 2006 Annual Report Download - page 116
Download and view the complete annual report
Please find page 116 of the 2006 Siemens annual report below. You can navigate through the pages in the report by either clicking on the pages listed below, or by using the keyword search tool below to find specific information within the annual report.-
 1
1 -
2
-
3
-
4
-
5
-
6
-
7
-
8
-
9
-
10
-
11
-
12
-
13
-
14
-
15
-
16
-
17
-
18
-
19
-
20
-
21
-
22
-
23
-
24
-
25
-
26
-
27
-
28
-
29
-
30
-
31
-
32
-
33
-
34
-
35
-
36
-
37
-
38
-
39
-
40
-
41
-
42
-
43
-
44
-
45
-
46
-
47
-
48
-
49
-
50
-
51
-
52
-
53
-
54
-
55
-
56
-
57
-
58
-
59
-
60
-
61
-
62
-
63
-
64
-
65
-
66
-
67
-
68
-
69
-
70
-
71
-
72
-
73
-
74
-
75
-
76
-
77
-
78
-
79
-
80
-
81
-
82
-
83
-
84
-
85
-
86
-
87
-
88
-
89
-
90
-
91
-
92
-
93
-
94
-
95
-
96
-
97
-
98
-
99
-
100
-
101
-
102
-
103
-
104
-
105
-
 106
106 -
 107
107 -
 108
108 -
 109
109 -
 110
110 -
 111
111 -
 112
112 -
 113
113 -
 114
114 -
 115
115 -
 116
116 -
 117
117 -
 118
118 -
 119
119 -
 120
120 -
 121
121 -
 122
122 -
 123
123 -
 124
124 -
 125
125 -
 126
126 -
127
-
128
-
129
-
130
-
131
-
132
-
133
-
134
-
135
-
136
-
137
-
138
-
139
-
140
-
141
-
142
-
143
-
144
-
145
-
146
-
147
-
148
-
149
-
150
-
151
-
152
-
153
-
154
-
155
-
156
-
157
-
158
-
159
-
160
-
161
-
162
-
163
-
164
-
165
-
166
-
167
-
168
-
169
-
170
-
171
-
172
-
173
-
174
-
175
-
176
-
177
-
178
-
179
-
180
-
181
-
182
-
183
-
184
-
185
-
186
-
187
-
188
-
189
-
190
-
191
-
192
-
193
-
194
-
195
-
196
-
197
-
198
-
199
-
200
-
201
-
202
-
203
-
204
-
205
-
206
-
207
-
208
-
209
-
210
-
211
-
212
-
213
-
214
-
215
-
216
-
217
-
218
-
219
-
220
-
221
-
222
-
223
-
224
-
225
-
226
-
227
-
228
-
229
-
230
-
231
-
232
-
233
-
234
-
235
-
236
-
237
-
238
-
239
-
240
-
241
-
242
-
243
-
244
-
245
-
246
-
247
-
248
-
249
-
250
-
251
-
252
-
253
-
254
-
255
-
256
-
257
-
258
-
259
-
260
 |
 |

Management’s discussion and analysis
112
Transportation
Transportation Systems (TS)
TS posted a solid increase in earnings in fiscal 2006, on improved project execution. Group
profit of €80 million was up 78% year-over-year, and higher in all four quarters compared to
corresponding periods of fiscal 2005. Group profit in both years included charges related to
major projects that are now moving toward or into the latter stages of completion. Broad-based
growth increased sales for TS overall by 7%, to €4.502 billion. The Group’s order backlog con-
tinued to rise on a 34% increase in orders, to €6.173 billion, including especially high order
volume in the first quarter. Highlights for the full year include large contracts for trains in
China, Russia (including a substantial maintenance contract), Spain and Austria.
Siemens VDO Automotive (SV)
In fiscal 2006, SV continued to invest in advanced solutions, such as for hybrid electric
vehicles, advanced driver assistance systems (ADAS) and electronic wedge brakes, while
increasing its competitiveness through cost-reduction programs. Group profit of €669 million,
up 6% year-over-year, included higher R&D expenses year-over-year and charges associated
with capacity adjustments. Group profit benefited from gains on divestments related to joint
ventures in the U.S and Europe. Sales and orders rose to €10.017 billion and €10.014 billion,
respectively.
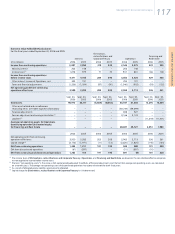
Year ended September 30,
% Change
(€ in millions) 2006 2005 Actual Adjusted*
Group profit 80 45 78%
Group profit margin 1.8% 1.1%
Sales 4,502 4,190 7% 5%
New orders 6,173 4,599 34% 32%
* Excluding currency translation effects of 1% on orders, and portfolio effects of 2% and 1% on sales and orders,
respectively.
Year ended September 30,
% Change
(€ in millions) 2006 2005 Actual Adjusted*
Group profit 669 630 6%
Group profit margin 6.7% 6.6%
Sales 10,017 9,610 4% 1%
New orders 10,014 9,787 2% (1)%
* Excluding currency translation effects of 2% on sales and orders, and portfolio effects of 1% on sales and orders.