Siemens 2006 Annual Report Download - page 120
Download and view the complete annual report
Please find page 120 of the 2006 Siemens annual report below. You can navigate through the pages in the report by either clicking on the pages listed below, or by using the keyword search tool below to find specific information within the annual report.-
 1
1 -
2
-
3
-
4
-
5
-
6
-
7
-
8
-
9
-
10
-
11
-
12
-
13
-
14
-
15
-
16
-
17
-
18
-
19
-
20
-
21
-
22
-
23
-
24
-
25
-
26
-
27
-
28
-
29
-
30
-
31
-
32
-
33
-
34
-
35
-
36
-
37
-
38
-
39
-
40
-
41
-
42
-
43
-
44
-
45
-
46
-
47
-
48
-
49
-
50
-
51
-
52
-
53
-
54
-
55
-
56
-
57
-
58
-
59
-
60
-
61
-
62
-
63
-
64
-
65
-
66
-
67
-
68
-
69
-
70
-
71
-
72
-
73
-
74
-
75
-
76
-
77
-
78
-
79
-
80
-
81
-
82
-
83
-
84
-
85
-
86
-
87
-
88
-
89
-
90
-
91
-
92
-
93
-
94
-
95
-
96
-
97
-
98
-
99
-
100
-
101
-
102
-
103
-
104
-
105
-
106
-
107
-
108
-
109
-
 110
110 -
 111
111 -
 112
112 -
 113
113 -
 114
114 -
 115
115 -
 116
116 -
 117
117 -
 118
118 -
 119
119 -
 120
120 -
 121
121 -
 122
122 -
 123
123 -
 124
124 -
 125
125 -
 126
126 -
 127
127 -
 128
128 -
 129
129 -
 130
130 -
131
-
132
-
133
-
134
-
135
-
136
-
137
-
138
-
139
-
140
-
141
-
142
-
143
-
144
-
145
-
146
-
147
-
148
-
149
-
150
-
151
-
152
-
153
-
154
-
155
-
156
-
157
-
158
-
159
-
160
-
161
-
162
-
163
-
164
-
165
-
166
-
167
-
168
-
169
-
170
-
171
-
172
-
173
-
174
-
175
-
176
-
177
-
178
-
179
-
180
-
181
-
182
-
183
-
184
-
185
-
186
-
187
-
188
-
189
-
190
-
191
-
192
-
193
-
194
-
195
-
196
-
197
-
198
-
199
-
200
-
201
-
202
-
203
-
204
-
205
-
206
-
207
-
208
-
209
-
210
-
211
-
212
-
213
-
214
-
215
-
216
-
217
-
218
-
219
-
220
-
221
-
222
-
223
-
224
-
225
-
226
-
227
-
228
-
229
-
230
-
231
-
232
-
233
-
234
-
235
-
236
-
237
-
238
-
239
-
240
-
241
-
242
-
243
-
244
-
245
-
246
-
247
-
248
-
249
-
250
-
251
-
252
-
253
-
254
-
255
-
256
-
257
-
258
-
259
-
260
 |
 |

Management’s discussion and analysis
116
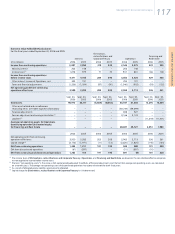
EVA performance
During fiscal 2006, Siemens continued its enterprise-wide focus on economic value added
(EVA). We tie a significant portion of our executive incentive compensation to achieving EVA
targets.
EVA is a financial performance measure of the value created or destroyed by a business. In
simple terms, it compares the earnings of a business (using Group profit for the Operations
Groups and income before income taxes for the Financing and Real Estate businesses as a
base) against the cost of capital employed to run that business. A positive EVA means that a
business has earned more than its cost of capital, whereas a negative EVA means that a busi-
ness has earned less than its cost of capital. Depending on the change of EVA between compa-
rable fiscal periods, a business is defined as value-creating or value-destroying. Consequently,
the increase or decrease in EVA is an important measure of financial performance.
We use this measure of performance in addition to Group profit and income before income
taxes because those measures focus on results without taking into consideration the cost of
capital employed in the business. In this manner, EVA complements Group profit and income
before income taxes. For EVA calculation purposes, data from the consolidated financial state-
ments is used and to a limited extent adjusted. The most important financial adjustment, rep-
resenting the major part of the total EVA adjustment amount within our Operations compo-
nent, results from operating lease commitments. We believe that including such financial
adjustment in the EVA measure enhances our business decision-making processes.
As the two major business components of Siemens – Operations compared to Financing
and Real Estate – are fundamentally different from each other, we use two types of EVA calcula-
tions: the industry concept in the case of Operations Groups and the financial concept in the
case of Financing and Real Estate.
In the case of Operations Groups, we use Group profit as the base measure and apply a flat
tax rate for calculating the operating profit after taxes. The cost of capital for each Group is
determined by taking the weighted average of the after-tax cost of debt and equity of Siemens
and applying a risk-based factor which takes into account the specific risk associated with the
particular business.
In the case of Financing and Real Estate, we use the financial concept to calculate the EVA.
As the base measure we use income before income taxes and apply a flat tax rate to arrive at
the net operating profit after taxes. From this result, we deduct the capital charge, which is cal-
culated by multiplying the cost of capital expressed as a percentage by the risk-adjusted equity
allocated to this component. Since the cost of debt is already considered within the income
before income taxes, the cost of capital is only based on equity components. The EVA for Cor-
porate Treasury is calculated similarly to Financing and Real Estate.
Other organizations that use EVA as a measure of financial performance may define and
calculate EVA differently.
Based on continuing operations, Siemens created EVA of €1.324 billion in fiscal 2006 com-
pared to €1.311 billion a year earlier. Including discontinued operations, EVA was up to €1.263
billion in fiscal 2006 compared to €414 million in fiscal 2005.