Siemens 2006 Annual Report Download - page 194
Download and view the complete annual report
Please find page 194 of the 2006 Siemens annual report below. You can navigate through the pages in the report by either clicking on the pages listed below, or by using the keyword search tool below to find specific information within the annual report.-
 1
1 -
2
-
3
-
4
-
5
-
6
-
7
-
8
-
9
-
10
-
11
-
12
-
13
-
14
-
15
-
16
-
17
-
18
-
19
-
20
-
21
-
22
-
23
-
24
-
25
-
26
-
27
-
28
-
29
-
30
-
31
-
32
-
33
-
34
-
35
-
36
-
37
-
38
-
39
-
40
-
41
-
42
-
43
-
44
-
45
-
46
-
47
-
48
-
49
-
50
-
51
-
52
-
53
-
54
-
55
-
56
-
57
-
58
-
59
-
60
-
61
-
62
-
63
-
64
-
65
-
66
-
67
-
68
-
69
-
70
-
71
-
72
-
73
-
74
-
75
-
76
-
77
-
78
-
79
-
80
-
81
-
82
-
83
-
84
-
85
-
86
-
87
-
88
-
89
-
90
-
91
-
92
-
93
-
94
-
95
-
96
-
97
-
98
-
99
-
100
-
101
-
102
-
103
-
104
-
105
-
106
-
107
-
108
-
109
-
110
-
111
-
112
-
113
-
114
-
115
-
116
-
117
-
118
-
119
-
120
-
121
-
122
-
123
-
124
-
125
-
126
-
127
-
128
-
129
-
130
-
131
-
132
-
133
-
134
-
135
-
136
-
137
-
138
-
139
-
140
-
141
-
142
-
143
-
144
-
145
-
146
-
147
-
148
-
149
-
150
-
151
-
152
-
153
-
154
-
155
-
156
-
157
-
158
-
159
-
160
-
161
-
162
-
163
-
164
-
165
-
166
-
167
-
168
-
169
-
170
-
171
-
172
-
173
-
174
-
175
-
176
-
177
-
178
-
179
-
180
-
181
-
182
-
183
-
 184
184 -
 185
185 -
 186
186 -
 187
187 -
 188
188 -
 189
189 -
 190
190 -
 191
191 -
 192
192 -
 193
193 -
 194
194 -
 195
195 -
 196
196 -
 197
197 -
 198
198 -
 199
199 -
 200
200 -
 201
201 -
 202
202 -
 203
203 -
 204
204 -
205
-
206
-
207
-
208
-
209
-
210
-
211
-
212
-
213
-
214
-
215
-
216
-
217
-
218
-
219
-
220
-
221
-
222
-
223
-
224
-
225
-
226
-
227
-
228
-
229
-
230
-
231
-
232
-
233
-
234
-
235
-
236
-
237
-
238
-
239
-
240
-
241
-
242
-
243
-
244
-
245
-
246
-
247
-
248
-
249
-
250
-
251
-
252
-
253
-
254
-
255
-
256
-
257
-
258
-
259
-
260
 |
 |

Notes to Consolidated Financial Statements
(in millions of €, except where otherwise stated and per share amounts)
190
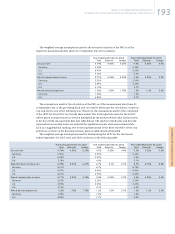
A detailed reconciliation of the changes in the PBO for fiscal 2006 and 2005 as well as
additional information by country is provided in the following table:
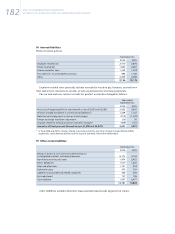
The total projected benefit obligation at the end of the fiscal year includes approximately
€10,537 for active employees, €3,009 for former employees with vested benefits and €12,699
for retirees and surviving dependents.
In fiscal 2006, the PBO decreased due to an increase in discount rate for the domestic and
foreign pension plans. In fiscal 2005, the PBO increased due to a decrease in discount rate for
the domestic and foreign pension plans.
The following table shows the change in plan assets for fiscal year 2006 and 2005 and some
additional information concerning pension plans:
September 30, 2006 September 30, 2005
Total Domestic Foreign Total Domestic Foreign
Change in projected benefit obligations:
Projected benefit obligation at beginning of year 24,977 15,932 9,045 20,794 13,851 6,943
Foreign currency exchange rate changes (201) – (201) 185 – 185
Service cost 713 388 325 579 307 272
Interest cost 1,108 679 429 1,121 726 395
Settlements and curtailment (1) – (1) (5) – (5)
Plan participants’ contributions 49 – 49 46 – 46
Amendments and other 1,526 443 1,083 (85) – (85)
Actuarial (gains) losses, net (587) (196) (391) 2,897 1,736 1,161
Acquisitions 89 59 30 624 138 486
Divestments (303) (145) (158) (147) (75) (72)
Benefits paid (1,125) (788) (337) (1,032) (751) (281)
Projected benefit obligation at end of year 26,245 16,372 9,873 24,977 15,932 9,045
Germany 16,372 15,932
U.S. 3,424 3,921
U.K. 3,354 3,098
Other 3,095 2,026
September 30, 2006 September 30, 2005
Total Domestic Foreign Total Domestic Foreign
Change in plan assets:
Fair value of plan assets at beginning of year 21,479 14,349 7,130 17,708 11,965 5,743
Foreign currency exchange rate changes (168) – (168) 135 – 135
Actual return on plan assets 1,291 741 550 2,289 1,596 693
Acquisitions and other 1,494 440 1,054 325 – 325
Divestments and other (222) (39) (183) (26) – (26)
Employer contributions (supplemental) – – – 1,496 1,380 116
Employer contributions (regular) 730 320 410 535 159 376
Plan participants’ contributions 49 – 49 49 – 49
Benefits paid (1,125) (788) (337) (1,032) (751) (281)
Fair value of plan assets at end of year 23,528 15,023 8,505 21,479 14,349 7,130
Germany 15,023 14,349
U.S. 2,989 3,063
U.K. 2,730 2,319
Other 2,786 1,748