Siemens 2006 Annual Report Download - page 121
Download and view the complete annual report
Please find page 121 of the 2006 Siemens annual report below. You can navigate through the pages in the report by either clicking on the pages listed below, or by using the keyword search tool below to find specific information within the annual report.-
 1
1 -
2
-
3
-
4
-
5
-
6
-
7
-
8
-
9
-
10
-
11
-
12
-
13
-
14
-
15
-
16
-
17
-
18
-
19
-
20
-
21
-
22
-
23
-
24
-
25
-
26
-
27
-
28
-
29
-
30
-
31
-
32
-
33
-
34
-
35
-
36
-
37
-
38
-
39
-
40
-
41
-
42
-
43
-
44
-
45
-
46
-
47
-
48
-
49
-
50
-
51
-
52
-
53
-
54
-
55
-
56
-
57
-
58
-
59
-
60
-
61
-
62
-
63
-
64
-
65
-
66
-
67
-
68
-
69
-
70
-
71
-
72
-
73
-
74
-
75
-
76
-
77
-
78
-
79
-
80
-
81
-
82
-
83
-
84
-
85
-
86
-
87
-
88
-
89
-
90
-
91
-
92
-
93
-
94
-
95
-
96
-
97
-
98
-
99
-
100
-
101
-
102
-
103
-
104
-
105
-
106
-
107
-
108
-
109
-
110
-
 111
111 -
 112
112 -
 113
113 -
 114
114 -
 115
115 -
 116
116 -
 117
117 -
 118
118 -
 119
119 -
 120
120 -
 121
121 -
 122
122 -
 123
123 -
 124
124 -
 125
125 -
 126
126 -
 127
127 -
 128
128 -
 129
129 -
 130
130 -
 131
131 -
132
-
133
-
134
-
135
-
136
-
137
-
138
-
139
-
140
-
141
-
142
-
143
-
144
-
145
-
146
-
147
-
148
-
149
-
150
-
151
-
152
-
153
-
154
-
155
-
156
-
157
-
158
-
159
-
160
-
161
-
162
-
163
-
164
-
165
-
166
-
167
-
168
-
169
-
170
-
171
-
172
-
173
-
174
-
175
-
176
-
177
-
178
-
179
-
180
-
181
-
182
-
183
-
184
-
185
-
186
-
187
-
188
-
189
-
190
-
191
-
192
-
193
-
194
-
195
-
196
-
197
-
198
-
199
-
200
-
201
-
202
-
203
-
204
-
205
-
206
-
207
-
208
-
209
-
210
-
211
-
212
-
213
-
214
-
215
-
216
-
217
-
218
-
219
-
220
-
221
-
222
-
223
-
224
-
225
-
226
-
227
-
228
-
229
-
230
-
231
-
232
-
233
-
234
-
235
-
236
-
237
-
238
-
239
-
240
-
241
-
242
-
243
-
244
-
245
-
246
-
247
-
248
-
249
-
250
-
251
-
252
-
253
-
254
-
255
-
256
-
257
-
258
-
259
-
260
 |
 |

Management’s discussion and analysis 117
Management’s discussion and analysis
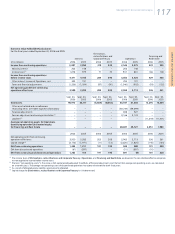
(1) The income taxes of Eliminations, reclassifications and Corporate Treasury, Operations, and Financing and Real Estate are based on the consolidated effective corporate
tax rate applied to income before income taxes.
(2) The term “net operating assets” is the same as Net capital employed except the effects of financial adjustments and the fact that average net operating assets are calculated
on a monthly basis. The average net operating assets of discontinued operations have been eliminated for both fiscal years.
(3) As a result of allocated equity, liabilities are also partly allocated.
(4) Capital charge for Eliminations, reclassifications and Corporate Treasury is risk-determined.
Economic Value Added (EVA) calculation
For the fiscal years ended September 30, 2006 and 2005
Eliminations,
reclassifications and Financing and
Siemens Corporate Tresury Operations Real Estate
(€ in millions) 2006 2005 2006 2005 2006 2005 2006 2005
Income from continuing operations 3,087 3,058 218 228 2,546 2,475 323 355
Minority interest 206 148 – – 206 148 – –
Income taxes(1) 1,078 979 71 70 901 801 106 108
Income from continuing operations
before income taxes 4,371 4,185 289 298 3,653 3,424 429 463
Other interest income of Operations, net 355 191 – – 355 191 – –
Taxes and financial adjustments (1,226) (1,094) (87) (90) (1,046) (902) (93) (102)
Net operating profit from continuing
operations after taxes 3,500 3,282 202 208 2,962 2,713 336 361
Sept. 30, Sept. 30, Sept. 30, Sept. 30, Sept. 30, Sept. 30, Sept. 30, Sept. 30,
2006 2005 2006 2005 2006 2005 2006 2005
Total assets 90,973 86,117 (5,869) (8,553) 83,547 81,366 13,295 13,304
Other asset related and miscellaneous
reconciling items (see table segment information) – – – – (58,734) (59,699) – –
Financial adjustments – – – – 848 927 – –
Pension adjustment and average calculation(2) – – – – 3,166 3,133 – –
Liabilities(3) – – – – – – (11,244) (11,401)
Average net operating assets for Operations
(continuing operations)/allocated equity
for Financing and Real Estate – – – – 28,827 25,727 2,051 1,903
2006 2005 2006 2005 2006 2005 2006 2005
Net operating profit from continuing
operations after taxes 3,500 3,282 202 208 2,962 2,713 336 361
Capital charge(4) (2,176) (1,971) (11) (13) (2,020) (1,825) (145) (133)
EVA from continuing operations 1,324 1,311 191 195 942 888 191 228
EVA from discontinued operations (61) (897) – – (51) (897) (10) –
EVA from continuing and discontinued operations 1,263 414 191 195 891 (9) 181 228