Siemens 2006 Annual Report Download - page 201
Download and view the complete annual report
Please find page 201 of the 2006 Siemens annual report below. You can navigate through the pages in the report by either clicking on the pages listed below, or by using the keyword search tool below to find specific information within the annual report.-
 1
1 -
2
-
3
-
4
-
5
-
6
-
7
-
8
-
9
-
10
-
11
-
12
-
13
-
14
-
15
-
16
-
17
-
18
-
19
-
20
-
21
-
22
-
23
-
24
-
25
-
26
-
27
-
28
-
29
-
30
-
31
-
32
-
33
-
34
-
35
-
36
-
37
-
38
-
39
-
40
-
41
-
42
-
43
-
44
-
45
-
46
-
47
-
48
-
49
-
50
-
51
-
52
-
53
-
54
-
55
-
56
-
57
-
58
-
59
-
60
-
61
-
62
-
63
-
64
-
65
-
66
-
67
-
68
-
69
-
70
-
71
-
72
-
73
-
74
-
75
-
76
-
77
-
78
-
79
-
80
-
81
-
82
-
83
-
84
-
85
-
86
-
87
-
88
-
89
-
90
-
91
-
92
-
93
-
94
-
95
-
96
-
97
-
98
-
99
-
100
-
101
-
102
-
103
-
104
-
105
-
106
-
107
-
108
-
109
-
110
-
111
-
112
-
113
-
114
-
115
-
116
-
117
-
118
-
119
-
120
-
121
-
122
-
123
-
124
-
125
-
126
-
127
-
128
-
129
-
130
-
131
-
132
-
133
-
134
-
135
-
136
-
137
-
138
-
139
-
140
-
141
-
142
-
143
-
144
-
145
-
146
-
147
-
148
-
149
-
150
-
151
-
152
-
153
-
154
-
155
-
156
-
157
-
158
-
159
-
160
-
161
-
162
-
163
-
164
-
165
-
166
-
167
-
168
-
169
-
170
-
171
-
172
-
173
-
174
-
175
-
176
-
177
-
178
-
179
-
180
-
181
-
182
-
183
-
184
-
185
-
186
-
187
-
188
-
189
-
190
-
 191
191 -
 192
192 -
 193
193 -
 194
194 -
 195
195 -
 196
196 -
 197
197 -
 198
198 -
 199
199 -
 200
200 -
 201
201 -
 202
202 -
 203
203 -
 204
204 -
 205
205 -
 206
206 -
 207
207 -
 208
208 -
 209
209 -
 210
210 -
 211
211 -
212
-
213
-
214
-
215
-
216
-
217
-
218
-
219
-
220
-
221
-
222
-
223
-
224
-
225
-
226
-
227
-
228
-
229
-
230
-
231
-
232
-
233
-
234
-
235
-
236
-
237
-
238
-
239
-
240
-
241
-
242
-
243
-
244
-
245
-
246
-
247
-
248
-
249
-
250
-
251
-
252
-
253
-
254
-
255
-
256
-
257
-
258
-
259
-
260
 |
 |

Notes to Consolidated Financial Statements
(in millions of €, except where otherwise stated and per share amounts) 197
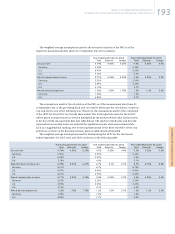
Other postretirement benefits: Obligations and funded status
The funded status of plan assets and a reconciliation of the funded status to the amounts
recognized in the Consolidated Balance Sheets is as follows:
The following table shows a detailed reconciliation of the changes in the benefit obligation
for other postretirement benefits for the years ended September 30, 2006 and 2005:
Other postretirement benefits: Plan assets
The following table shows the change in plan assets for fiscal 2006 and 2005:
Notes to Consolidated Financial Statements
September 30, 2006 September 30, 2005
Total Domestic Foreign Total Domestic Foreign
Fair value of plan assets 3 – 3 3 – 3
Accumulated postretirement benefit obligation 822 429 393 919 394 525
Funded status (819) (429) (390) (916) (394) (522)
Unrecognized net gain (402) (295) (107) (357) (318) (39)
Unrecognized prior service benefits (2) – (2) (44) – (44)
Net amount recognized (1,223) (724) (499) (1,317) (712) (605)
September 30, 2006 September 30, 2005
Total Domestic Foreign Total Domestic Foreign
Change in benefit obligations:
Accumulated postretirement benefit
obligation at beginning of year 919 394 525 939 443 496
Foreign currency exchange rate changes (23) – (23) 13 – 13
Service cost 27 15 12 26 14 12
Interest cost 43 18 25 52 23 29
Settlements and curtailments – – – (4) – (4)
Plan participants’ contributions – – – 2 – 2
Plan amendments and other 41 41 – (41) – (41)
Actuarial (gains) losses, net (65) 4 (69) (6) (59) 53
Divestments (53) (14) (39) (7) (7) –
Benefits paid (67) (29) (38) (55) (20) (35)
Accumulated postretirement benefit
obligation at end of year 822 429 393 919 394 525
September 30, 2006 September 30, 2005
Total Domestic Foreign Total Domestic Foreign
Change in plan assets
Fair value of plan assets at beginning of year 3 – 3 5 – 5
Employer contributions 38 – 38 31 – 31
Plan participants’ contributions – – – 2 – 2
Benefits paid (38) – (38) (35) – (35)
Fair value of plan assets at year end 3 – 3 3 – 3