Siemens 2006 Annual Report Download - page 117
Download and view the complete annual report
Please find page 117 of the 2006 Siemens annual report below. You can navigate through the pages in the report by either clicking on the pages listed below, or by using the keyword search tool below to find specific information within the annual report.-
 1
1 -
2
-
3
-
4
-
5
-
6
-
7
-
8
-
9
-
10
-
11
-
12
-
13
-
14
-
15
-
16
-
17
-
18
-
19
-
20
-
21
-
22
-
23
-
24
-
25
-
26
-
27
-
28
-
29
-
30
-
31
-
32
-
33
-
34
-
35
-
36
-
37
-
38
-
39
-
40
-
41
-
42
-
43
-
44
-
45
-
46
-
47
-
48
-
49
-
50
-
51
-
52
-
53
-
54
-
55
-
56
-
57
-
58
-
59
-
60
-
61
-
62
-
63
-
64
-
65
-
66
-
67
-
68
-
69
-
70
-
71
-
72
-
73
-
74
-
75
-
76
-
77
-
78
-
79
-
80
-
81
-
82
-
83
-
84
-
85
-
86
-
87
-
88
-
89
-
90
-
91
-
92
-
93
-
94
-
95
-
96
-
97
-
98
-
99
-
100
-
101
-
102
-
103
-
104
-
105
-
106
-
 107
107 -
 108
108 -
 109
109 -
 110
110 -
 111
111 -
 112
112 -
 113
113 -
 114
114 -
 115
115 -
 116
116 -
 117
117 -
 118
118 -
 119
119 -
 120
120 -
 121
121 -
 122
122 -
 123
123 -
 124
124 -
 125
125 -
 126
126 -
 127
127 -
128
-
129
-
130
-
131
-
132
-
133
-
134
-
135
-
136
-
137
-
138
-
139
-
140
-
141
-
142
-
143
-
144
-
145
-
146
-
147
-
148
-
149
-
150
-
151
-
152
-
153
-
154
-
155
-
156
-
157
-
158
-
159
-
160
-
161
-
162
-
163
-
164
-
165
-
166
-
167
-
168
-
169
-
170
-
171
-
172
-
173
-
174
-
175
-
176
-
177
-
178
-
179
-
180
-
181
-
182
-
183
-
184
-
185
-
186
-
187
-
188
-
189
-
190
-
191
-
192
-
193
-
194
-
195
-
196
-
197
-
198
-
199
-
200
-
201
-
202
-
203
-
204
-
205
-
206
-
207
-
208
-
209
-
210
-
211
-
212
-
213
-
214
-
215
-
216
-
217
-
218
-
219
-
220
-
221
-
222
-
223
-
224
-
225
-
226
-
227
-
228
-
229
-
230
-
231
-
232
-
233
-
234
-
235
-
236
-
237
-
238
-
239
-
240
-
241
-
242
-
243
-
244
-
245
-
246
-
247
-
248
-
249
-
250
-
251
-
252
-
253
-
254
-
255
-
256
-
257
-
258
-
259
-
260
 |
 |

Management’s discussion and analysis 113
Medical
Medical Solutions (Med)
Med was again a top earnings performer, with €1.061 billion in Group profit in fiscal 2006.
Broad-based earnings increases in the Group’s diagnostics imaging businesses more than
offset increases in R&D investments compared to the prior year. CTI Molecular Imaging, Inc.
(CTI), acquired in the third quarter of fiscal 2005, also contributed to earnings growth for the
year. Sales and orders both rose 8% compared to a year earlier, to €8.227 billion and €9.334
billion, respectively.
In the fourth quarter of fiscal 2006, Med acquired DPC, a leading provider of in-vitro
clinical diagnostics headquartered in the U.S. The purchase price for DPC, including cash
acquired, was approximately €1.4 billion. In the third quarter, Siemens announced an agree-
ment to acquire the Diagnostics division of Bayer AG, which is strongly positioned in the field
of immunodiagnostics. This transaction, with an expected purchase price of approximately
€4.2 billion, has already received European Union and U.S. regulatory approval and is
expected to close in the first half of fiscal 2007. The two acquisitions will substantially expand
Med’s total available market and bring the Group new capabilities that are highly complemen-
tary to its existing offerings and we expect that integrating the diagnostics acquisitions will
be a significant management focus at Med in fiscal 2007.
Lighting
Osram
In fiscal 2006, Osram stepped up its commitment to its fastest-growing regional markets,
including the build-out of a new regional office and expanded sales efforts in Asia-Pacific. The
Group also increased up-front investments in innovative products. Group profit rose 3% to
€481 million while sales and orders rose 6%, to €4.563 billion, on regionally balanced growth.
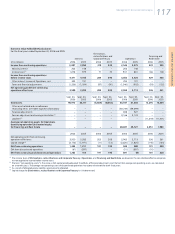
Management’s discussion and analysis
Year ended September 30,
% Change
(€ in millions) 2006 2005 Actual Adjusted*
Group profit 1,061 976 9%
Group profit margin 12.9% 12.8%
Sales 8,227 7,626 8% 5%
New orders 9,334 8,641 8% 6%
* Excluding currency translation effects of 2% and 1% on sales and orders, respectively, and portfolio effects
of 1% on sales and orders.
Year ended September 30,
% Change
(€ in millions) 2006 2005 Actual Adjusted*
Group profit 481 465 3%
Group profit margin 10.5% 10.8%
Sales 4,563 4,300 6% 4%
New orders 4,563 4,300 6% 4%
* Excluding currency translation effects of 2% on sales and orders.