Siemens 2006 Annual Report Download - page 197
Download and view the complete annual report
Please find page 197 of the 2006 Siemens annual report below. You can navigate through the pages in the report by either clicking on the pages listed below, or by using the keyword search tool below to find specific information within the annual report.-
 1
1 -
2
-
3
-
4
-
5
-
6
-
7
-
8
-
9
-
10
-
11
-
12
-
13
-
14
-
15
-
16
-
17
-
18
-
19
-
20
-
21
-
22
-
23
-
24
-
25
-
26
-
27
-
28
-
29
-
30
-
31
-
32
-
33
-
34
-
35
-
36
-
37
-
38
-
39
-
40
-
41
-
42
-
43
-
44
-
45
-
46
-
47
-
48
-
49
-
50
-
51
-
52
-
53
-
54
-
55
-
56
-
57
-
58
-
59
-
60
-
61
-
62
-
63
-
64
-
65
-
66
-
67
-
68
-
69
-
70
-
71
-
72
-
73
-
74
-
75
-
76
-
77
-
78
-
79
-
80
-
81
-
82
-
83
-
84
-
85
-
86
-
87
-
88
-
89
-
90
-
91
-
92
-
93
-
94
-
95
-
96
-
97
-
98
-
99
-
100
-
101
-
102
-
103
-
104
-
105
-
106
-
107
-
108
-
109
-
110
-
111
-
112
-
113
-
114
-
115
-
116
-
117
-
118
-
119
-
120
-
121
-
122
-
123
-
124
-
125
-
126
-
127
-
128
-
129
-
130
-
131
-
132
-
133
-
134
-
135
-
136
-
137
-
138
-
139
-
140
-
141
-
142
-
143
-
144
-
145
-
146
-
147
-
148
-
149
-
150
-
151
-
152
-
153
-
154
-
155
-
156
-
157
-
158
-
159
-
160
-
161
-
162
-
163
-
164
-
165
-
166
-
167
-
168
-
169
-
170
-
171
-
172
-
173
-
174
-
175
-
176
-
177
-
178
-
179
-
180
-
181
-
182
-
183
-
184
-
185
-
186
-
 187
187 -
 188
188 -
 189
189 -
 190
190 -
 191
191 -
 192
192 -
 193
193 -
 194
194 -
 195
195 -
 196
196 -
 197
197 -
 198
198 -
 199
199 -
 200
200 -
 201
201 -
 202
202 -
 203
203 -
 204
204 -
 205
205 -
 206
206 -
 207
207 -
208
-
209
-
210
-
211
-
212
-
213
-
214
-
215
-
216
-
217
-
218
-
219
-
220
-
221
-
222
-
223
-
224
-
225
-
226
-
227
-
228
-
229
-
230
-
231
-
232
-
233
-
234
-
235
-
236
-
237
-
238
-
239
-
240
-
241
-
242
-
243
-
244
-
245
-
246
-
247
-
248
-
249
-
250
-
251
-
252
-
253
-
254
-
255
-
256
-
257
-
258
-
259
-
260
 |
 |

Notes to Consolidated Financial Statements
(in millions of €, except where otherwise stated and per share amounts) 193
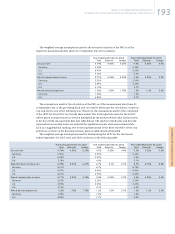
The weighted-average assumptions used for the actuarial valuation of the PBO as of the
respective measurement date (June 30 or September 30), were as follows:
The assumptions used for the calculation of the PBO as of the measurement date (June 30
or September 30), of the preceding fiscal year are used to determine the calculation of interest
cost and service cost of the following year. Therefore, the assumptions used for the calculation
of the NPPC for fiscal 2007 are already determined. The total expected return for fiscal 2007
will be based on expected rates of return multiplied by the market-related value of plan assets
at the fiscal 2006 measurement date (see table below). The market-related value and thus the
expected return on plan assets are adjusted for significant events after measurement date,
such as a supplemental funding. Due to the implementation of the BSAV, the effect of the com-
pensation increase on the domestic pension plans is substantially eliminated.
The weighted-average assumptions used for determining the NPPC for the fiscal years
ended September 30, 2007, 2006 and 2005 are shown in the following table:
Notes to Consolidated Financial Statements
Year ended September 30, 2006 Year ended September 30, 2005
Total Domestic Foreign Total Domestic Foreign
Discount rate 4.79% 4.50% 5.25% 4.5% 4.35% 4.9%
Germany 4.50% 4.35%
U.S. 6.49% 5.25%
U.K. 5.18% 4.9%
Rate of compensation increase 2.71% 2.25% 3.43% 2.6% 2.25% 3.2%
Germany 2.25% 2.25%
U.S. 3.95% 3.25%
U.K. 3.74% 3.7%
Rate of pension progression 1.22% 1.00% 1.78% 1.2% 1.0% 2.0%
Germany 1.00% 1.0%
U.K. 2.82% 2.7%
Year ending September 30, 2007 Year ended September 30, 2006 Year ended September 30, 2005
Total Domestic Foreign Total Domestic Foreign Total Domestic Foreign
Discount rate 4.79% 4.50% 5.25% 4.5% 4.35% 4.9% 5.5% 5.25% 5.9%
Germany 4.50% 4.35% 5.25%
U.S. 6.49% 5.25% 6.5%
U.K. 5.18% 4.9% 5.7%
Expected return on plan assets 6.49% 6.51% 6.47% 6.7% 6.7% 6.7% 6.7% 6.75% 6.6%
Germany 6.51% 6.7% 6.75%
U.S. 6.97% 6.95% 6.95%
U.K. 6.67% 6.75% 6.85%
Rate of compensation increase 2.71% 2.25% 3.43% 2.6% 2.25% 3.2% 2.6% 2.25% 3.3%
Germany 2.25% 2.25% 2.25%
U.S. 3.95% 3.25% 3.25%
U.K. 3.74% 3.7% 4.0%
Rate of pension progression 1.22% 1.00% 1.78% 1.2% 1.0% 2.0% 1.3% 1.0% 2.3%
Germany 1.00% 1.0% 1.0%
U.K. 2.82% 2.7% 2.8%