Siemens 2006 Annual Report Download - page 193
Download and view the complete annual report
Please find page 193 of the 2006 Siemens annual report below. You can navigate through the pages in the report by either clicking on the pages listed below, or by using the keyword search tool below to find specific information within the annual report.-
 1
1 -
2
-
3
-
4
-
5
-
6
-
7
-
8
-
9
-
10
-
11
-
12
-
13
-
14
-
15
-
16
-
17
-
18
-
19
-
20
-
21
-
22
-
23
-
24
-
25
-
26
-
27
-
28
-
29
-
30
-
31
-
32
-
33
-
34
-
35
-
36
-
37
-
38
-
39
-
40
-
41
-
42
-
43
-
44
-
45
-
46
-
47
-
48
-
49
-
50
-
51
-
52
-
53
-
54
-
55
-
56
-
57
-
58
-
59
-
60
-
61
-
62
-
63
-
64
-
65
-
66
-
67
-
68
-
69
-
70
-
71
-
72
-
73
-
74
-
75
-
76
-
77
-
78
-
79
-
80
-
81
-
82
-
83
-
84
-
85
-
86
-
87
-
88
-
89
-
90
-
91
-
92
-
93
-
94
-
95
-
96
-
97
-
98
-
99
-
100
-
101
-
102
-
103
-
104
-
105
-
106
-
107
-
108
-
109
-
110
-
111
-
112
-
113
-
114
-
115
-
116
-
117
-
118
-
119
-
120
-
121
-
122
-
123
-
124
-
125
-
126
-
127
-
128
-
129
-
130
-
131
-
132
-
133
-
134
-
135
-
136
-
137
-
138
-
139
-
140
-
141
-
142
-
143
-
144
-
145
-
146
-
147
-
148
-
149
-
150
-
151
-
152
-
153
-
154
-
155
-
156
-
157
-
158
-
159
-
160
-
161
-
162
-
163
-
164
-
165
-
166
-
167
-
168
-
169
-
170
-
171
-
172
-
173
-
174
-
175
-
176
-
177
-
178
-
179
-
180
-
181
-
182
-
 183
183 -
 184
184 -
 185
185 -
 186
186 -
 187
187 -
 188
188 -
 189
189 -
 190
190 -
 191
191 -
 192
192 -
 193
193 -
 194
194 -
 195
195 -
 196
196 -
 197
197 -
 198
198 -
 199
199 -
 200
200 -
 201
201 -
 202
202 -
 203
203 -
204
-
205
-
206
-
207
-
208
-
209
-
210
-
211
-
212
-
213
-
214
-
215
-
216
-
217
-
218
-
219
-
220
-
221
-
222
-
223
-
224
-
225
-
226
-
227
-
228
-
229
-
230
-
231
-
232
-
233
-
234
-
235
-
236
-
237
-
238
-
239
-
240
-
241
-
242
-
243
-
244
-
245
-
246
-
247
-
248
-
249
-
250
-
251
-
252
-
253
-
254
-
255
-
256
-
257
-
258
-
259
-
260
 |
 |

Notes to Consolidated Financial Statements
(in millions of €, except where otherwise stated and per share amounts) 189
The Company’s principal pension benefit plans are explicitly explained in the subsequent
sections with regard to:
■Pension obligations and funded status,
■Recognition of an additional minimum liability (AML),
■Components of NPPC,
■Assumptions for the calculation of the PBO and NPPC,
■Sensitivity analysis,
■Additional information concerning changes of the AML and the actual returns on plan
assets,
■Plan assets,
■Pension plan funding, and
■Pension benefit payments.
Pension benefits: Pension obligations and funded status
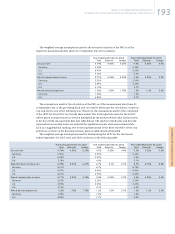
A reconciliation of the funded status of the principal pension benefit plans to the amounts
recognized in the Consolidated Balance Sheets is as follows:
The measurement date of the PBO and fair value of plan assets of the Company’s domestic
pension benefit plans is September 30, and either September 30 or June 30 for the majority of
its foreign plans. For plans with a measurement date of June 30, the actual investment return
of the plan assets relate to the period from July 1, of the prior fiscal year, until June 30 of the
current fiscal year.
Notes to Consolidated Financial Statements
September 30, 2006 September 30, 2005
Total Domestic Foreign Total Domestic Foreign
Fair value of plan assets 23,528 15,023 8,505 21,479 14,349 7,130
Projected benefit obligation (PBO) 26,245 16,372 9,873 24,977 15,932 9,045
Funded status(1) (2,717) (1,349) (1,368) (3,498) (1,583) (1,915)
Germany (1,349) (1,583)
U.S. (435) (858)
U.K. (624) (779)
Other (309) (278)
Unrecognized net losses(2) 10,575 8,653 1,922 11,835 9,198 2,637
Unrecognized prior service cost (benefit) (133) (251) 118 (285) (270) (15)
Net amount recognized 7,725 7,053 672 8,052 7,345 707
Amounts recognized in the Consolidated
Balance Sheets consist of:
Prepaid pension assets 534 – 534 166 – 166
Accrued pension liability (2,039) (1,289) (750) (2,749) (1,504) (1,245)
Intangible assets 108 – 108 62 – 62
Accumulated other comprehensive loss 9,122 8,342 780 10,573 8,849 1,724
Net amount recognized 7,725 7,053 672 8,052 7,345 707
(1) Funded status: The funded status shows the surplus/(deficit) of the PBO relative to the plan assets as of the measurement date,
and, where applicable, fundings between the measurement date and the balance sheet date. The PBO is calculated based on
the projected unit credit method and reflects the net present value as of the measurement date of the accumulated pension
entitlements of active employees, former employees with vested rights and of retirees and their surviving dependents with
consideration of future compensation and pension increases.
(2) Unrecognized net losses: The NPPC is determined at the beginning of the relevant measurement period based on assumptions
for the discount rate, compensation increase rate and pension progression rate as well as the long-term rate of return on plan
assets. The cumulative effect of differences between the actual experience and the assumed assumptions and changes in the
assumptions are disclosed in the line item unrecognized net losses.