Siemens 2006 Annual Report Download - page 196
Download and view the complete annual report
Please find page 196 of the 2006 Siemens annual report below. You can navigate through the pages in the report by either clicking on the pages listed below, or by using the keyword search tool below to find specific information within the annual report.-
 1
1 -
2
-
3
-
4
-
5
-
6
-
7
-
8
-
9
-
10
-
11
-
12
-
13
-
14
-
15
-
16
-
17
-
18
-
19
-
20
-
21
-
22
-
23
-
24
-
25
-
26
-
27
-
28
-
29
-
30
-
31
-
32
-
33
-
34
-
35
-
36
-
37
-
38
-
39
-
40
-
41
-
42
-
43
-
44
-
45
-
46
-
47
-
48
-
49
-
50
-
51
-
52
-
53
-
54
-
55
-
56
-
57
-
58
-
59
-
60
-
61
-
62
-
63
-
64
-
65
-
66
-
67
-
68
-
69
-
70
-
71
-
72
-
73
-
74
-
75
-
76
-
77
-
78
-
79
-
80
-
81
-
82
-
83
-
84
-
85
-
86
-
87
-
88
-
89
-
90
-
91
-
92
-
93
-
94
-
95
-
96
-
97
-
98
-
99
-
100
-
101
-
102
-
103
-
104
-
105
-
106
-
107
-
108
-
109
-
110
-
111
-
112
-
113
-
114
-
115
-
116
-
117
-
118
-
119
-
120
-
121
-
122
-
123
-
124
-
125
-
126
-
127
-
128
-
129
-
130
-
131
-
132
-
133
-
134
-
135
-
136
-
137
-
138
-
139
-
140
-
141
-
142
-
143
-
144
-
145
-
146
-
147
-
148
-
149
-
150
-
151
-
152
-
153
-
154
-
155
-
156
-
157
-
158
-
159
-
160
-
161
-
162
-
163
-
164
-
165
-
166
-
167
-
168
-
169
-
170
-
171
-
172
-
173
-
174
-
175
-
176
-
177
-
178
-
179
-
180
-
181
-
182
-
183
-
184
-
185
-
 186
186 -
 187
187 -
 188
188 -
 189
189 -
 190
190 -
 191
191 -
 192
192 -
 193
193 -
 194
194 -
 195
195 -
 196
196 -
 197
197 -
 198
198 -
 199
199 -
 200
200 -
 201
201 -
 202
202 -
 203
203 -
 204
204 -
 205
205 -
 206
206 -
207
-
208
-
209
-
210
-
211
-
212
-
213
-
214
-
215
-
216
-
217
-
218
-
219
-
220
-
221
-
222
-
223
-
224
-
225
-
226
-
227
-
228
-
229
-
230
-
231
-
232
-
233
-
234
-
235
-
236
-
237
-
238
-
239
-
240
-
241
-
242
-
243
-
244
-
245
-
246
-
247
-
248
-
249
-
250
-
251
-
252
-
253
-
254
-
255
-
256
-
257
-
258
-
259
-
260
 |
 |

Notes to Consolidated Financial Statements
(in millions of €, except where otherwise stated and per share amounts)
192
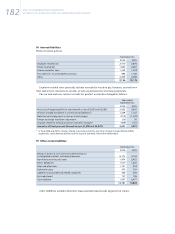
Pension benefits: Components of NPPC
The components of the NPPC for the fiscal years ended September 30, 2006 and 2005 were as
follows:
For the Siemens German Pension Trust, the determination of the expected return on plan
assets and the amortization of unrecognized net losses are based on a market-related value of
plan assets calculated using the average of historical market values of plan assets over four
quarters. This market-related value was €14,164 and €13,730 as of September 30, 2006 and
2005, respectively, €74 below and €449 below, respectively, the fair value of plan assets of the
Siemens German Pension Trust. For all other plans, the market-related value of plan assets is
equal to the fair value of plan assets as of the measurement date. If any significant supplemen-
tal contributions are made after the measurement date, these contributions will be considered
on a pro-rata basis when determining the total expected return on plan assets for the respec-
tive fiscal year.
Net unrecognized gains or losses in excess of 10% of the greater of the projected benefit
obligation or the market-related value of plan assets are amortized over the average remain-
ing service period of active participants. Prior service costs are amortized on a straight-line
basis over the average remaining service period of active participants to whom such costs
relate.
The amortization of unrecognized net losses is mainly due to negative developments in
the international capital markets during fiscal 2002 and 2001, as well as the effect of reduc-
tions in the discount rate assumption used to calculate the PBO in fiscal 2003 and 2005. Net
actuarial losses decreased during fiscal 2006 predominantly due to an increase of the discount
rate assumption used to measure the PBO, partially offset by actuarial losses resulting from
pension assets where actual returns fall short of expected returns. The net effect did not
impact NPPC for fiscal 2006 but will decrease amortization of unrecognized net losses in
future periods.
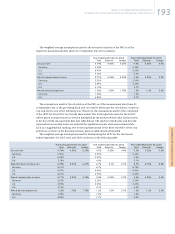
Pension benefits: Assumptions for the calculation of the PBO and NPPC
Assumed discount rates, compensation increase rates and pension progression rates used in
calculating the PBO together with long-term rates of return on plan assets vary according to
the economic conditions of the country in which the retirement plans are situated or where
plan assets are invested as well as capital market expectations.
Year ended September 30, 2006 Year ended September 30, 2005
Total Domestic Foreign Total Domestic Foreign
Service cost 713 388 325 579 307 272
Interest cost 1,108 679 429 1,121 726 395
Expected return on plan assets (1,388) (923) (465) (1,291) (905) (386)
Amortization of:
Unrecognized prior service cost (benefits) (11) (19) 8 (9) (19) 10
Unrecognized net losses 686 531 155 561 475 86
Loss due to settlements and curtailments 2 – 2 3 – 3
Net periodic pension cost 1,110 656 454 964 584 380
Germany 656 584
U.S. 253 190
U.K. 166 149
Other 35 41