Sprint - Nextel 2007 Annual Report Download - page 35
Download and view the complete annual report
Please find page 35 of the 2007 Sprint - Nextel annual report below. You can navigate through the pages in the report by either clicking on the pages listed below, or by using the keyword search tool below to find specific information within the annual report.-
 1
1 -
2
-
3
-
4
-
5
-
6
-
7
-
8
-
9
-
10
-
11
-
12
-
13
-
14
-
15
-
16
-
17
-
18
-
19
-
20
-
21
-
22
-
23
-
24
-
 25
25 -
 26
26 -
 27
27 -
 28
28 -
 29
29 -
 30
30 -
 31
31 -
 32
32 -
 33
33 -
 34
34 -
 35
35 -
 36
36 -
 37
37 -
 38
38 -
 39
39 -
 40
40 -
 41
41 -
 42
42 -
 43
43 -
 44
44 -
 45
45 -
46
-
47
-
48
-
49
-
50
-
51
-
52
-
53
-
54
-
55
-
56
-
57
-
58
-
59
-
60
-
61
-
62
-
63
-
64
-
65
-
66
-
67
-
68
-
69
-
70
-
71
-
72
-
73
-
74
-
75
-
76
-
77
-
78
-
79
-
80
-
81
-
82
-
83
-
84
-
85
-
86
-
87
-
88
-
89
-
90
-
91
-
92
-
93
-
94
-
95
-
96
-
97
-
98
-
99
-
100
-
101
-
102
-
103
-
104
-
105
-
106
-
107
-
108
-
109
-
110
-
111
-
112
-
113
-
114
-
115
-
116
-
117
-
118
-
119
-
120
-
121
-
122
-
123
-
124
-
125
-
126
-
127
-
128
-
129
-
130
-
131
-
132
-
133
-
134
-
135
-
136
-
137
-
138
-
139
-
140
-
141
-
142
 |
 |

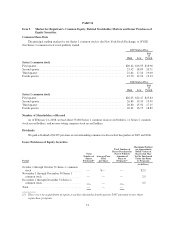
Item 6. Selected Financial Data
The 2007 and 2006 data presented below is not comparable to that of the prior periods primarily as a result
of the August 2005 Sprint-Nextel merger and the Nextel Partners and the PCS Affiliate acquisitions. The
acquired companies’ financial results subsequent to their acquisition dates are included in our consolidated
financial statements. Embarq, which was spun-off in 2006, and our directory publishing business, which was sold
in 2003, are shown as discontinued operations for all periods presented.
Year Ended December 31,
2007 2006 2005 2004 2003
(in millions, except per share amounts)
Results of Operations
Net operating revenues ........................ $40,146 $41,003 $ 28,771 $21,647 $20,414
Goodwill impairment(1) ........................ 29,729 — — — —
Depreciation ................................ 5,711 5,738 3,864 3,651 3,909
Amortization ................................ 3,312 3,854 1,336 7 1
Operating income (loss)(1)(2) .................... (28,910) 2,484 2,141 (1,999) (729)
Income (loss) from continuing operations(1)(2) ...... (29,580) 995 821 (2,006) (1,306)
Discontinued operations, net .................... — 334 980 994 2,338
Cumulative effect of change in accounting principle,
net(3) ..................................... — — (16) — 258
Earnings (Loss) per Share and Dividends
Basic and diluted earnings (loss) per common share(4)
Continuing operations(1)(2) .................... $ (10.31) $ 0.34 $ 0.40 $ (1.40) $ (0.92)
Discontinued operations ..................... — 0.11 0.48 0.69 1.65
Cumulative effect of change in accounting
principle(3) .............................. — — (0.01) — 0.18
Dividends per common share(5) ................. 0.10 0.10 0.30 See (5) below
Financial Position
Total assets(1) ................................ $64,109 $97,161 $102,760 $41,321 $42,675
Property, plant and equipment, net ............... 26,496 25,868 23,329 14,662 19,130
Intangible assets, net(1) ........................ 28,096 60,057 49,307 7,809 7,788
Total debt and capital lease obligations (including
equity unit notes) ........................... 22,130 22,154 25,014 16,425 18,243
Seventh series redeemable preferred shares ........ — — 247 247 247
Shareholders’ equity(1) ........................ 21,999 53,131 51,937 13,521 13,113
Cash Flow Data
Net cash from continuing operating activities ...... $ 9,245 $10,055 $ 8,655 $ 4,478 $ 4,141
Capital expenditures .......................... 6,322 7,556 5,057 3,980 3,797
(1) In the fourth quarter 2007, we performed our annual assessment of goodwill for impairment and recorded a
non-cash goodwill impairment charge of $29.7 billion. Refer to note 3 of the Notes to Consolidated
Financial Statements for additional information regarding the assessment process and charge.
(2) In 2007, we recorded net charges of $956 million ($590 million after tax) primarily related to merger and
integration costs, asset impairments, and severance and exit costs. In 2006, we recorded net charges of
$620 million ($381 million after tax) primarily related to merger and integration costs, asset impairments,
and severance and exit costs. In 2005, we recorded net charges of $723 million ($445 million after tax)
primarily related to merger and integration costs, asset impairments, and severance and hurricane-related
costs. In 2004, we recorded net charges of $3.7 billion ($2.3 billion after tax) primarily related to severance
and Wireline network impairment, partially offset by recoveries of fully reserved MCI (now Verizon)
receivables. In 2003, we recorded net charges of $1.9 billion ($1.2 billion after tax) primarily related to
33