Sprint - Nextel 2007 Annual Report Download - page 57
Download and view the complete annual report
Please find page 57 of the 2007 Sprint - Nextel annual report below. You can navigate through the pages in the report by either clicking on the pages listed below, or by using the keyword search tool below to find specific information within the annual report.-
 1
1 -
2
-
3
-
4
-
5
-
6
-
7
-
8
-
9
-
10
-
11
-
12
-
13
-
14
-
15
-
16
-
17
-
18
-
19
-
20
-
21
-
22
-
23
-
24
-
25
-
26
-
27
-
28
-
29
-
30
-
31
-
32
-
33
-
34
-
35
-
36
-
37
-
38
-
39
-
40
-
41
-
42
-
43
-
44
-
45
-
46
-
 47
47 -
 48
48 -
 49
49 -
 50
50 -
 51
51 -
 52
52 -
 53
53 -
 54
54 -
 55
55 -
 56
56 -
 57
57 -
 58
58 -
 59
59 -
 60
60 -
 61
61 -
 62
62 -
 63
63 -
 64
64 -
 65
65 -
 66
66 -
 67
67 -
68
-
69
-
70
-
71
-
72
-
73
-
74
-
75
-
76
-
77
-
78
-
79
-
80
-
81
-
82
-
83
-
84
-
85
-
86
-
87
-
88
-
89
-
90
-
91
-
92
-
93
-
94
-
95
-
96
-
97
-
98
-
99
-
100
-
101
-
102
-
103
-
104
-
105
-
106
-
107
-
108
-
109
-
110
-
111
-
112
-
113
-
114
-
115
-
116
-
117
-
118
-
119
-
120
-
121
-
122
-
123
-
124
-
125
-
126
-
127
-
128
-
129
-
130
-
131
-
132
-
133
-
134
-
135
-
136
-
137
-
138
-
139
-
140
-
141
-
142
 |
 |

future outcomes; to the extent that our actual experience differs significantly from historical trends, the required
allowance amounts could differ from our estimate. Any resulting adjustments would change the net accounts
receivable reported on our balance sheet, and bad debt expense, in the case of estimates related to doubtful
accounts, or revenue, in the case of estimates related to other allowances, reported in our results of operations in
future periods. For example, if our allowance for doubtful accounts estimate were to change by 10%, it would
result in a corresponding change in bad debt expense of $37 million for the Wireless segment and $2 million for
the Wireline segment.
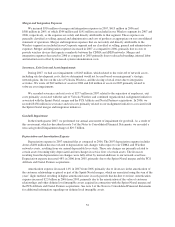
Device and Accessory Inventory
Inventories of handsets and accessories in the Wireless segment are stated at the lower of cost or market.
We determine cost by the first-in, first-out, or FIFO, method. Handset costs and related revenues are recognized
at the time of sale. We do not recognize the expected handset subsidies prior to the time of sale because the
promotional discount decision is made at the point of sale, and we expect to recover the handset subsidies
through service revenues.
As of December 31, 2007, we held $938 million of inventory. We analyze the realizable value of our
handset and other inventory on a quarterly basis. This analysis includes assessing obsolescence, sales forecasts,
product life cycle and marketplace and other considerations. If our assessments regarding the above factors
change, we may be required to sell handsets at a higher subsidy or potentially record expense in future periods
prior to the point of sale to the extent that we expect that we will be unable to sell handsets or use them in the
service and repair channel.
Valuation and Recoverability of Certain Long-lived Assets Including Definite Lived Intangible Assets
A significant portion of our total assets are long-lived assets, including property, plant and equipment and
definite lived intangible assets. Changes in technology or in our intended use of these assets, as well as changes
in economic or industry factors or in our business or prospects, may cause the estimated period of use or the
value of these assets to change.
Property, plant and equipment represented $26.5 billion of our $64.1 billion in total assets as of
December 31, 2007. We generally calculate depreciation on these assets using the straight-line method based on
estimated economic useful lives as follows:
Long-lived Assets Estimated Useful Life Average Useful Life
Buildings and improvements ......................... 3to30years 12 years
Network equipment, site costs and software ............. 3to31years 8 years
Non-network internal use software, office equipment and
other .......................................... 3to12years 4 years
We calculate depreciation on certain of our assets using the group life method. Accordingly, ordinary asset
retirements and disposals are charged against accumulated depreciation with no gain or loss recognized.
Since changes in technology or in our intended use of these assets, as well as changes in broad economic or
industry factors, may cause the estimated period of use of these assets to change, we perform annual internal
studies to confirm the appropriateness of depreciable lives for certain categories of property, plant and
equipment. These studies take into account actual usage, physical wear and tear, replacement history, and
assumptions about technology evolution, to calculate the remaining life of our asset base. When these factors
indicate that an asset’s useful life is different from the original assessment, we depreciate the remaining book
values prospectively over the adjusted estimated useful life.
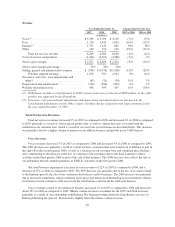
During the first quarter 2007, we implemented depreciation rate changes with respect to assets that
comprise the CDMA and Wireline networks resulting from our annual depreciable lives study. These revised
rates reflected both changes in the useful life estimates of certain of our asset groups and adjustments to our
55