Sprint - Nextel 2007 Annual Report Download - page 52
Download and view the complete annual report
Please find page 52 of the 2007 Sprint - Nextel annual report below. You can navigate through the pages in the report by either clicking on the pages listed below, or by using the keyword search tool below to find specific information within the annual report.-
 1
1 -
2
-
3
-
4
-
5
-
6
-
7
-
8
-
9
-
10
-
11
-
12
-
13
-
14
-
15
-
16
-
17
-
18
-
19
-
20
-
21
-
22
-
23
-
24
-
25
-
26
-
27
-
28
-
29
-
30
-
31
-
32
-
33
-
34
-
35
-
36
-
37
-
38
-
39
-
40
-
41
-
 42
42 -
 43
43 -
 44
44 -
 45
45 -
 46
46 -
 47
47 -
 48
48 -
 49
49 -
 50
50 -
 51
51 -
 52
52 -
 53
53 -
 54
54 -
 55
55 -
 56
56 -
 57
57 -
 58
58 -
 59
59 -
 60
60 -
 61
61 -
 62
62 -
63
-
64
-
65
-
66
-
67
-
68
-
69
-
70
-
71
-
72
-
73
-
74
-
75
-
76
-
77
-
78
-
79
-
80
-
81
-
82
-
83
-
84
-
85
-
86
-
87
-
88
-
89
-
90
-
91
-
92
-
93
-
94
-
95
-
96
-
97
-
98
-
99
-
100
-
101
-
102
-
103
-
104
-
105
-
106
-
107
-
108
-
109
-
110
-
111
-
112
-
113
-
114
-
115
-
116
-
117
-
118
-
119
-
120
-
121
-
122
-
123
-
124
-
125
-
126
-
127
-
128
-
129
-
130
-
131
-
132
-
133
-
134
-
135
-
136
-
137
-
138
-
139
-
140
-
141
-
142
 |
 |
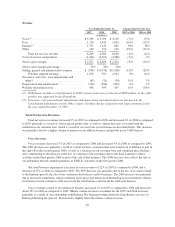
Voice revenues generated from the provision of services to the Wireless segment represented 23% of total
voice revenues in 2007 as compared to 17% in 2006 and 14% in 2005.
Data Revenues
Data revenues reflect sales of legacy data services, including ATM, frame relay and managed network
services. Data revenues decreased 16% in 2007 as compared to 2006 and decreased 12% in 2006 as compared to
2005 due to declines in frame relay and ATM services as customers migrated to IP-based technologies. These
declines were partially offset by growth in managed network services.
Internet Revenues
Internet revenues reflect sales of IP-based data services, including MPLS. Internet revenues increased 38%
in 2007 as compared to 2006 and increased 38% in 2006 as compared to 2005. The increases were due to higher
IP revenues as business customers increasingly migrate to MPLS services, as well as revenue growth in our cable
VoIP business, which experienced a 80% increase in 2007 as compared to 2006 and an 127% increase in 2006 as
compared to 2005.
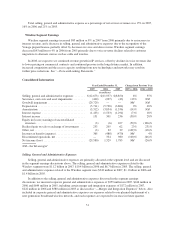
Other Revenues
Other revenues, which primarily consists of sales of customer premises equipment, or CPE, decreased 22%
in 2007 as compared to 2006 and decreased 13% in 2006 as compared to 2005 as a result of fewer projects in
2007 and 2006.
Costs of Services and Products
Costs of services and products include access costs paid to local phone companies, other domestic service
providers and foreign phone companies to complete calls made by our domestic customers, costs to operate and
maintain our networks and costs of equipment. Costs of services and products decreased 1% in 2007 from 2006
and increased 2% in 2006 from 2005. The decrease in 2007 relates to decreased costs due to declining volumes
and improved access cost rates in the retail business, partially offset by increased activity in the wholesale and
cable VoIP businesses. The increase in 2006 relates primarily to network costs to support growth in our cable
initiatives in addition to increased domestic access volume, partially offset by fewer CPE projects in 2006, the
loss of UNE-P customers and renegotiated access rate agreements and initiatives to reduce access circuit costs.
Service gross margin percentage decreased from 36% in 2005 to 32% in 2006 to 31% in 2007, primarily as
a result of declining net services revenue and a lower margin product mix.
Selling, General and Administrative Expense
Selling, general and administrative expense decreased 13% in 2007 as compared to 2006 and decreased 23%
in 2006 as compared to 2005. The 2007 decline was due primarily to recognition of a prepaid license from
Vonage covering the use of certain patents within our patent portfolio, as well as a reduction in employee
headcount, reduced commissions as a result of the spin-off of Embarq and decreased customer care and billing
expenses due to a smaller customer base. These declines were partially offset by increases in costs associated
with cable VoIP support. The 2006 decline was due primarily to decreased marketing and advertising as a result
of a change in the mix of marketing strategies and lower general and administrative and information technology
expenses.
Selling, general and administrative expense includes charges for estimated bad debt expense. Each quarter
we reassess our allowance for doubtful accounts based on customer-specific indicators, as well as historical
trends and industry data, to ensure we are adequately reserved. In 2007, bad debt expense increased slightly
primarily due to customer specific reserves. The improvement between 2006 and 2005 reflects improved trends
in collections and agings.
50