Sprint - Nextel 2007 Annual Report Download - page 46
Download and view the complete annual report
Please find page 46 of the 2007 Sprint - Nextel annual report below. You can navigate through the pages in the report by either clicking on the pages listed below, or by using the keyword search tool below to find specific information within the annual report.-
 1
1 -
2
-
3
-
4
-
5
-
6
-
7
-
8
-
9
-
10
-
11
-
12
-
13
-
14
-
15
-
16
-
17
-
18
-
19
-
20
-
21
-
22
-
23
-
24
-
25
-
26
-
27
-
28
-
29
-
30
-
31
-
32
-
33
-
34
-
35
-
 36
36 -
 37
37 -
 38
38 -
 39
39 -
 40
40 -
 41
41 -
 42
42 -
 43
43 -
 44
44 -
 45
45 -
 46
46 -
 47
47 -
 48
48 -
 49
49 -
 50
50 -
 51
51 -
 52
52 -
 53
53 -
 54
54 -
 55
55 -
 56
56 -
57
-
58
-
59
-
60
-
61
-
62
-
63
-
64
-
65
-
66
-
67
-
68
-
69
-
70
-
71
-
72
-
73
-
74
-
75
-
76
-
77
-
78
-
79
-
80
-
81
-
82
-
83
-
84
-
85
-
86
-
87
-
88
-
89
-
90
-
91
-
92
-
93
-
94
-
95
-
96
-
97
-
98
-
99
-
100
-
101
-
102
-
103
-
104
-
105
-
106
-
107
-
108
-
109
-
110
-
111
-
112
-
113
-
114
-
115
-
116
-
117
-
118
-
119
-
120
-
121
-
122
-
123
-
124
-
125
-
126
-
127
-
128
-
129
-
130
-
131
-
132
-
133
-
134
-
135
-
136
-
137
-
138
-
139
-
140
-
141
-
142
 |
 |

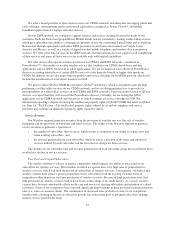
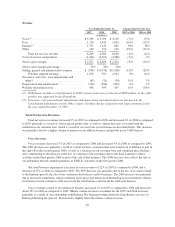
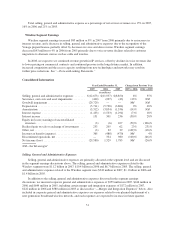
Segment Results of Operations
Wireless
Year Ended December 31, Change from Previous Year
2007 2006 2005 2007 vs 2006 2006 vs 2005
(in millions)
Service ................................... $31,044 $ 31,059 $19,289 0% 61%
Wholesale, affiliate and other ................. 1,061 870 908 22% (4)%
Total services revenue ................... 32,105 31,929 20,197 1% 58%
Cost of services(1) ........................... (8,612) (8,058) (5,419) 7% 49%
Service gross margin ........................ $23,493 $ 23,871 $14,778 (2)% 62%
Service gross margin percentage ............... 73% 75% 73%
Equipment revenue ......................... $ 2,595 $ 3,172 $ 2,129 (18)% 49%
Cost of products(1) .......................... (5,023) (4,927) (3,272) 2% 51%
Equipment net subsidy .................. $ (2,428) $ (1,755) $ (1,143) 38% 54%
Equipment net subsidy percentage ............. (94)% (55)% (54)%
Selling, general and administrative expense(1) .... $(11,151) $(10,438) $ (6,703) 7% 56%
Wireless segment earnings ............... 9,914 11,678 6,932 (15)% 68%
Merger and integration expenses(1) ............. (344) (191) — 80% NM
Severance, exit costs, asset impairments and other,
net(2) ................................... (394) (179) (105) 120% 70%
Goodwill impairment(3) ...................... (29,729) — — NM NM
Depreciation(2) ............................. (5,175) (5,232) (3,364) (1)% 56%
Amortization(2) ............................. (3,310) (3,854) (1,335) (14)% 189%
Wireless operating income (loss) .............. (29,038) 2,222 2,128 NM 4%
NM—Not Meaningful
(1) Merger and integration expenses are discussed in the Consolidated Information section. These amounts
include $63 million for the year ended December 31, 2006, which has been reclassified from the Corporate
segment as these expenses are solely and directly attributable to the Wireless segment.
(2) Severance, exit costs, asset impairments, depreciation and amortization are discussed in the Consolidated
Information section. Other expense, net includes net costs associated with the exit of a non-core line of
business, and for the year ended December 31, 2007 includes charges associated with legal contingencies
and insurance recoveries.
(3) During 2007, we recognized a $29.7 billion non-cash impairment charge to goodwill related to the Wireless
segment, which is recorded as a component of operating income. Goodwill impairment is further discussed
in the Consolidated Information section.
Service Revenue
Service revenues consist of fixed monthly recurring charges, variable usage charges and miscellaneous fees
such as activation fees, directory assistance, operator-assisted calling, equipment protection, late payment and
early termination charges and certain regulatory related fees. Service revenue totaled $31.0 billion in 2007,
$31.1 billion in 2006 and $19.3 billion in 2005.
44