Sprint - Nextel 2007 Annual Report Download - page 51
Download and view the complete annual report
Please find page 51 of the 2007 Sprint - Nextel annual report below. You can navigate through the pages in the report by either clicking on the pages listed below, or by using the keyword search tool below to find specific information within the annual report.-
 1
1 -
2
-
3
-
4
-
5
-
6
-
7
-
8
-
9
-
10
-
11
-
12
-
13
-
14
-
15
-
16
-
17
-
18
-
19
-
20
-
21
-
22
-
23
-
24
-
25
-
26
-
27
-
28
-
29
-
30
-
31
-
32
-
33
-
34
-
35
-
36
-
37
-
38
-
39
-
40
-
 41
41 -
 42
42 -
 43
43 -
 44
44 -
 45
45 -
 46
46 -
 47
47 -
 48
48 -
 49
49 -
 50
50 -
 51
51 -
 52
52 -
 53
53 -
 54
54 -
 55
55 -
 56
56 -
 57
57 -
 58
58 -
 59
59 -
 60
60 -
 61
61 -
62
-
63
-
64
-
65
-
66
-
67
-
68
-
69
-
70
-
71
-
72
-
73
-
74
-
75
-
76
-
77
-
78
-
79
-
80
-
81
-
82
-
83
-
84
-
85
-
86
-
87
-
88
-
89
-
90
-
91
-
92
-
93
-
94
-
95
-
96
-
97
-
98
-
99
-
100
-
101
-
102
-
103
-
104
-
105
-
106
-
107
-
108
-
109
-
110
-
111
-
112
-
113
-
114
-
115
-
116
-
117
-
118
-
119
-
120
-
121
-
122
-
123
-
124
-
125
-
126
-
127
-
128
-
129
-
130
-
131
-
132
-
133
-
134
-
135
-
136
-
137
-
138
-
139
-
140
-
141
-
142
 |
 |

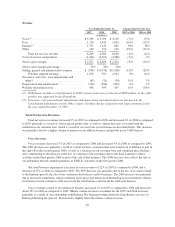
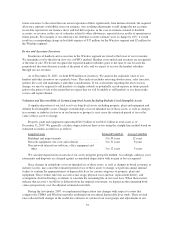
Wireline
Year Ended December 31, Change from Previous Year
2007 2006 2005 2007 vs 2006 2006 vs 2005
(in millions)
Voice(1) ................................... $3,509 $ 3,769 $ 4,120 (7)% (9)%
Data ..................................... 1,210 1,432 1,620 (16)% (12)%
Internet(1) ................................. 1,575 1,143 829 38% 38%
Other ..................................... 169 216 249 (22)% (13)%
Total net services revenue ................ 6,463 6,560 6,818 (1)% (4)%
Costs of services and products ................. (4,446) (4,491) (4,386) (1)% 2%
Service gross margin ........................ $2,017 $ 2,069 $ 2,432 (3)% (15)%
Service gross margin percentage ............... 31% 32% 36%
Selling, general and administrative expense ...... $ (943) $(1,078) $(1,398) (13)% (23)%
Wireline segment earnings ................ 1,074 991 1,034 8% (4)%
Severance, exit costs, asset impairments and
other(2) .................................. (42) (31) (30) 35% 3%
Depreciation and amortization(2) ............... (534) (506) (499) 6% 1%
Wireline operating income .................... 498 454 505 10% (10)%
(1) 2006 figures include a reclassification of VoIP revenues from voice to internet of $209 million, as the cable
product was supported by the IP platform.
(2) Severance, exit costs and asset impairments and depreciation and amortization are discussed in the
Consolidated Information section. Other expense includes charges associated with legal contingencies for
the year ended December 31, 2007.
Total Net Services Revenues
Total net services revenues decreased 1% in 2007 as compared to 2006 and decreased 4% in 2006 as compared
to 2005, primarily as a result of a lower priced product mix, as well as volume decreases associated with the
reduction in our customer base, which is a result of our exit from several businesses described below. This decrease
was partially offset by a higher volume of minutes in our affiliate business and growth in our VoIP business.
Voice Revenues
Voice revenues decreased 7% in 2007 as compared to 2006 and decreased 9% in 2006 as compared to 2005.
The 2007 decrease was primarily a result of certain business customers that were transferred to Embarq as part of
the spin-off in the second quarter 2006, as well as a decrease in our customer base and continued price declines.
Also contributing to the decrease is the loss of conference line customers due to the final transition of those
activities in the third quarter 2006 as part of the sale of that business. The 2006 decrease also reflects the sale of
our unbundled network element platform, or UNE-P, customers in the first quarter 2006.
Our retail business experienced a decrease in voice revenues of 22% in 2007 as compared to 2006, and a
decrease of 25% in 2006 as compared to 2005. The 2007 decrease was primarily due to the loss of accounts related
to the Embarq spin-off, the sale of our conference line business and lower prices. The 2006 decrease was primarily
due to increased competition, which resulted in lower prices per minute notwithstanding increased minute volumes.
Our business trends continue to shift away from the retail business and toward the wholesale business.
Voice revenues related to our wholesale business increased 1% in 2007 as compared to 2006 and increased
about 19% in 2006 as compared to 2005. Minute volume increases accounted for the 2007 and 2006 increases,
primarily as a result of our relationship with Embarq. We began providing wholesale long distance services to
Embarq following the spin-off. Rate declines slightly offset the minute volume increase.
49