Sprint - Nextel 2007 Annual Report Download - page 53
Download and view the complete annual report
Please find page 53 of the 2007 Sprint - Nextel annual report below. You can navigate through the pages in the report by either clicking on the pages listed below, or by using the keyword search tool below to find specific information within the annual report.-
 1
1 -
2
-
3
-
4
-
5
-
6
-
7
-
8
-
9
-
10
-
11
-
12
-
13
-
14
-
15
-
16
-
17
-
18
-
19
-
20
-
21
-
22
-
23
-
24
-
25
-
26
-
27
-
28
-
29
-
30
-
31
-
32
-
33
-
34
-
35
-
36
-
37
-
38
-
39
-
40
-
41
-
42
-
 43
43 -
 44
44 -
 45
45 -
 46
46 -
 47
47 -
 48
48 -
 49
49 -
 50
50 -
 51
51 -
 52
52 -
 53
53 -
 54
54 -
 55
55 -
 56
56 -
 57
57 -
 58
58 -
 59
59 -
 60
60 -
 61
61 -
 62
62 -
 63
63 -
64
-
65
-
66
-
67
-
68
-
69
-
70
-
71
-
72
-
73
-
74
-
75
-
76
-
77
-
78
-
79
-
80
-
81
-
82
-
83
-
84
-
85
-
86
-
87
-
88
-
89
-
90
-
91
-
92
-
93
-
94
-
95
-
96
-
97
-
98
-
99
-
100
-
101
-
102
-
103
-
104
-
105
-
106
-
107
-
108
-
109
-
110
-
111
-
112
-
113
-
114
-
115
-
116
-
117
-
118
-
119
-
120
-
121
-
122
-
123
-
124
-
125
-
126
-
127
-
128
-
129
-
130
-
131
-
132
-
133
-
134
-
135
-
136
-
137
-
138
-
139
-
140
-
141
-
142
 |
 |

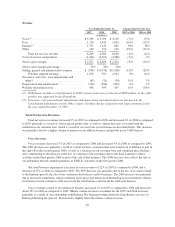
Total selling, general and administrative expense as a percentage of net services revenues was 15% in 2007,
16% in 2006 and 21% in 2005.
Wireline Segment Earnings
Wireline segment earnings increased $83 million or 8% in 2007 from 2006 primarily due to an increase in
internet revenue, and a decrease in selling, general and administrative expenses due to the recognition of the
Vonage prepaid license, partially offset by decreases in voice and data revenue. Wireline segment earnings
decreased $43 million or 4% in 2006 from 2005 primarily due to voice revenue declines related to customer
migrations to alternate sources such as cable and wireless.
In 2008, we expect to see continued revenue growth in IP services, offset by declines in voice revenues due
to lower pricing on commercial contracts and continued pressure in the long distance market. In addition,
increased competition and the excess capacity resulting from new technologies and networks may result in
further price reductions. See “—Forward-Looking Statements.”
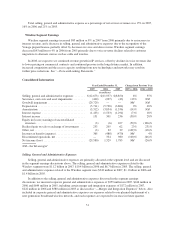
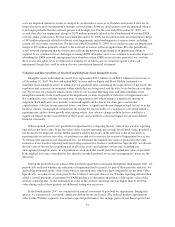
Consolidated Information
Year Ended December 31, Change from Previous Year
2007 2006 2005 2007 vs 2006 2006 vs 2005
(in millions)
Selling, general and administrative expenses ....... $(12,673) $(11,957) $(8,850) 6% 35%
Severance, exit costs and asset impairments ........ (440) (207) (43) 113% NM
Goodwill impairment .......................... (29,729) — — NM NM
Depreciation ................................. (5,711) (5,738) (3,864) 0% 48%
Amortization ................................ (3,312) (3,854) (1,336) (14)% NM
Interest expense .............................. (1,433) (1,533) (1,294) (7)% 18%
Interest income ............................... 151 301 236 (50)% 28%
Equity in (losses) earnings of unconsolidated
investees .................................. (3) (6) 107 (50)% (106)%
Realized gain on sale or exchange of investments . . . 253 205 62 23% 231%
Other, net ................................... (3) 32 39 (109)% (18)%
Income tax benefit (expense) .................... 365 (488) (470) NM 4%
Discontinued operations, net .................... — 334 980 (100)% (66)%
Net income (loss) ............................. (29,580) 1,329 1,785 NM (26)%
NM—Not Meaningful
Selling, General and Administrative Expenses
Selling, general and administrative expenses are primarily allocated at the segment level and are discussed
in the segment earnings discussions above. The selling, general and administrative expenses related to the
Wireless segment were $11.2 billion in 2007, $10.4 billion in 2006 and $6.7 billion in 2005. The selling, general
and administrative expenses related to the Wireline segment were $943 million in 2007, $1.1 billion in 2006 and
$1.4 billion in 2005.
In addition to the selling, general and administrative expenses discussed in the segment earnings
discussions, we incurred corporate general and administrative expenses of $359 million in 2007, $246 million in
2006 and $649 million in 2005, including certain merger and integration expenses of $172 million in 2007,
$222 million in 2006 and $580 million in 2005 as discussed in “—Merger and Integration Expenses” below. Also
included in corporate general and administrative expenses are expenses related to our planned deployment of a
next generation broadband wireless network, and such expenses are expected to increase in future quarters.
51