Sprint - Nextel 2007 Annual Report Download - page 90
Download and view the complete annual report
Please find page 90 of the 2007 Sprint - Nextel annual report below. You can navigate through the pages in the report by either clicking on the pages listed below, or by using the keyword search tool below to find specific information within the annual report.-
 1
1 -
2
-
3
-
4
-
5
-
6
-
7
-
8
-
9
-
10
-
11
-
12
-
13
-
14
-
15
-
16
-
17
-
18
-
19
-
20
-
21
-
22
-
23
-
24
-
25
-
26
-
27
-
28
-
29
-
30
-
31
-
32
-
33
-
34
-
35
-
36
-
37
-
38
-
39
-
40
-
41
-
42
-
43
-
44
-
45
-
46
-
47
-
48
-
49
-
50
-
51
-
52
-
53
-
54
-
55
-
56
-
57
-
58
-
59
-
60
-
61
-
62
-
63
-
64
-
65
-
66
-
67
-
68
-
69
-
70
-
71
-
72
-
73
-
74
-
75
-
76
-
77
-
78
-
79
-
 80
80 -
 81
81 -
 82
82 -
 83
83 -
 84
84 -
 85
85 -
 86
86 -
 87
87 -
 88
88 -
 89
89 -
 90
90 -
 91
91 -
 92
92 -
 93
93 -
 94
94 -
 95
95 -
 96
96 -
 97
97 -
 98
98 -
 99
99 -
 100
100 -
101
-
102
-
103
-
104
-
105
-
106
-
107
-
108
-
109
-
110
-
111
-
112
-
113
-
114
-
115
-
116
-
117
-
118
-
119
-
120
-
121
-
122
-
123
-
124
-
125
-
126
-
127
-
128
-
129
-
130
-
131
-
132
-
133
-
134
-
135
-
136
-
137
-
138
-
139
-
140
-
141
-
142
 |
 |

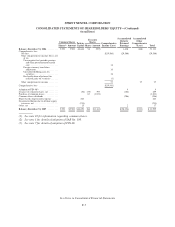
SPRINT NEXTEL CORPORATION
CONSOLIDATED STATEMENTS OF CASH FLOWS
Year Ended December 31,
2007 2006 2005
(in millions)
Cash flows from operating activities
Net (loss) income ............................................................... $(29,580) $ 1,329 $ 1,785
Adjustments to reconcile net (loss) income to net cash provided by operating activities:
Income from discontinued operations ........................................... — (334) (980)
Goodwill impairment ........................................................ 29,729 — —
Depreciation and amortization ................................................. 9,023 9,592 5,200
Provision for losses on accounts receivable ....................................... 920 656 388
Share-based compensation expense ............................................. 265 338 254
Losses on impairment of long-lived assets ........................................ 163 69 44
Gain on sale or exchange of investments, net ..................................... (253) (205) (62)
Deferred income taxes ....................................................... (360) 468 798
Other, net ................................................................. (194) (70) 108
Changes in assets and liabilities, net of effects of acquisitions:
Accounts and notes receivable ............................................. (504) (582) (364)
Inventories and other current assets ......................................... 182 (254) 23
Accounts payable and other current liabilities ................................. (471) (1,024) 380
Increase in communications towers lease liability .............................. — — 1,195
Non-current assets and liabilities, net ........................................ 325 72 (114)
Net cash provided by continuing operations .............................. 9,245 10,055 8,655
Net cash provided by discontinued operations ............................. — 903 2,024
Net cash provided by operating activities ................................ 9,245 10,958 10,679
Cash flows from investing activities
Capital expenditures ............................................................. (6,322) (7,556) (5,057)
Expenditures relating to FCC licenses and other intangible assets ......................... (844) (822) (150)
Acquisitions, net of cash acquired .................................................. (287) (10,481) (188)
Proceeds from sale of Embarq notes ................................................ — 4,447 —
Proceeds from spin-off of local communications business, net ............................ — 1,821 —
Proceeds from sale of investments .................................................. 329 752 380
Purchases of investments ......................................................... (8) — —
Proceeds from sales and maturities of marketable securities .............................. 15 1,657 808
Purchases of marketable securities .................................................. (194) (527) (821)
Proceeds from sale of property, plant and equipment and FCC licenses ..................... 42 90 268
Cash collateral for securities loan agreements ......................................... 866 (866) —
Other, net ..................................................................... 26 93 36
Net cash used in investing activities ..................................... (6,377) (11,392) (4,724)
Cash flows from financing activities
Borrowings under credit facility .................................................... 750 — 3,200
Proceeds from issuance of debt securities ............................................ 750 1,992 —
Purchase and retirements of debt ................................................... (1,392) (4,342) (1,170)
Retirement of bank facility term loan ................................................ — (3,700) (3,200)
Proceeds from issuance of commercial paper ......................................... 6,008 4,618 —
Maturities of commercial paper .................................................... (6,143) (4,104) —
Payments of securities loan agreements .............................................. (866) 866 —
Proceeds from issuance of common shares ........................................... 344 405 432
Purchase of common shares ....................................................... (1,833) (1,643) —
Retirement of redeemable preferred shares ........................................... — (247) —
Dividends paid ................................................................. (286) (296) (525)
Other, net ..................................................................... — 28 35
Net cash used in financing activities .................................... (2,668) (6,423) (1,228)
Net increase (decrease) in cash and cash equivalents ..................................... 200 (6,857) 4,727
Cash and cash equivalents, beginning of year ........................................... 2,046 8,903 4,176
Cash and cash equivalents, end of year ................................................ $ 2,246 $ 2,046 $ 8,903
See Notes to Consolidated Financial Statements
F-5