Sprint - Nextel 2007 Annual Report Download - page 89
Download and view the complete annual report
Please find page 89 of the 2007 Sprint - Nextel annual report below. You can navigate through the pages in the report by either clicking on the pages listed below, or by using the keyword search tool below to find specific information within the annual report.-
 1
1 -
2
-
3
-
4
-
5
-
6
-
7
-
8
-
9
-
10
-
11
-
12
-
13
-
14
-
15
-
16
-
17
-
18
-
19
-
20
-
21
-
22
-
23
-
24
-
25
-
26
-
27
-
28
-
29
-
30
-
31
-
32
-
33
-
34
-
35
-
36
-
37
-
38
-
39
-
40
-
41
-
42
-
43
-
44
-
45
-
46
-
47
-
48
-
49
-
50
-
51
-
52
-
53
-
54
-
55
-
56
-
57
-
58
-
59
-
60
-
61
-
62
-
63
-
64
-
65
-
66
-
67
-
68
-
69
-
70
-
71
-
72
-
73
-
74
-
75
-
76
-
77
-
78
-
 79
79 -
 80
80 -
 81
81 -
 82
82 -
 83
83 -
 84
84 -
 85
85 -
 86
86 -
 87
87 -
 88
88 -
 89
89 -
 90
90 -
 91
91 -
 92
92 -
 93
93 -
 94
94 -
 95
95 -
 96
96 -
 97
97 -
 98
98 -
 99
99 -
100
-
101
-
102
-
103
-
104
-
105
-
106
-
107
-
108
-
109
-
110
-
111
-
112
-
113
-
114
-
115
-
116
-
117
-
118
-
119
-
120
-
121
-
122
-
123
-
124
-
125
-
126
-
127
-
128
-
129
-
130
-
131
-
132
-
133
-
134
-
135
-
136
-
137
-
138
-
139
-
140
-
141
-
142
 |
 |

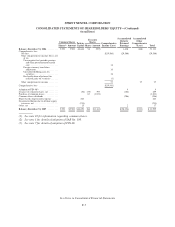
SPRINT NEXTEL CORPORATION
CONSOLIDATED STATEMENTS OF OPERATIONS
Year Ended December 31,
2007 2006 2005
(in millions, except per share amounts)
Net operating revenues ........................................... $ 40,146 $41,003 $28,771
Operating expenses
Cost of services and products (exclusive of depreciation included
below) .................................................... 17,191 16,763 12,537
Selling, general and administrative ............................... 12,673 11,957 8,850
Severance, exit costs and asset impairments ........................ 440 207 43
Goodwill impairment .......................................... 29,729 — —
Depreciation ................................................. 5,711 5,738 3,864
Amortization ................................................. 3,312 3,854 1,336
69,056 38,519 26,630
Operating income (loss) ........................................... (28,910) 2,484 2,141
Other income (expense)
Interest expense .............................................. (1,433) (1,533) (1,294)
Interest income ............................................... 151 301 236
Equity in (losses) earnings of unconsolidated investees, net ............ (3) (6) 107
Realized gain on sale or exchange of investments, net ................ 253 205 62
Other, net ................................................... (3) 32 39
(1,035) (1,001) (850)
Income (loss) from continuing operations before income taxes ........... (29,945) 1,483 1,291
Income tax benefit (expense) ....................................... 365 (488) (470)
Income (loss) from continuing operations ............................ (29,580) 995 821
Discontinued operations, net .................................... — 334 980
Cumulative effect of change in accounting principle, net .............. — — (16)
Net income (loss) ................................................. (29,580) 1,329 1,785
Preferred share dividends ....................................... — (2) (7)
Income (loss) available to common shareholders ...................... $ (29,580) $ 1,327 $ 1,778
Basic and diluted earnings (loss) per common share
Continuing operations ......................................... $ (10.31) $ 0.34 $ 0.40
Discontinued operations, net .................................... — 0.11 0.48
Cumulative effect of change in accounting principle, net .............. — — (0.01)
Total ................................................... $ (10.31) $ 0.45 $ 0.87
Basic weighted average common shares outstanding ................... 2,868 2,950 2,033
Diluted weighted average common shares outstanding ................. 2,868 2,972 2,054
See Notes to Consolidated Financial Statements
F-4