Sprint - Nextel 2007 Annual Report Download - page 47
Download and view the complete annual report
Please find page 47 of the 2007 Sprint - Nextel annual report below. You can navigate through the pages in the report by either clicking on the pages listed below, or by using the keyword search tool below to find specific information within the annual report.-
 1
1 -
2
-
3
-
4
-
5
-
6
-
7
-
8
-
9
-
10
-
11
-
12
-
13
-
14
-
15
-
16
-
17
-
18
-
19
-
20
-
21
-
22
-
23
-
24
-
25
-
26
-
27
-
28
-
29
-
30
-
31
-
32
-
33
-
34
-
35
-
36
-
 37
37 -
 38
38 -
 39
39 -
 40
40 -
 41
41 -
 42
42 -
 43
43 -
 44
44 -
 45
45 -
 46
46 -
 47
47 -
 48
48 -
 49
49 -
 50
50 -
 51
51 -
 52
52 -
 53
53 -
 54
54 -
 55
55 -
 56
56 -
 57
57 -
58
-
59
-
60
-
61
-
62
-
63
-
64
-
65
-
66
-
67
-
68
-
69
-
70
-
71
-
72
-
73
-
74
-
75
-
76
-
77
-
78
-
79
-
80
-
81
-
82
-
83
-
84
-
85
-
86
-
87
-
88
-
89
-
90
-
91
-
92
-
93
-
94
-
95
-
96
-
97
-
98
-
99
-
100
-
101
-
102
-
103
-
104
-
105
-
106
-
107
-
108
-
109
-
110
-
111
-
112
-
113
-
114
-
115
-
116
-
117
-
118
-
119
-
120
-
121
-
122
-
123
-
124
-
125
-
126
-
127
-
128
-
129
-
130
-
131
-
132
-
133
-
134
-
135
-
136
-
137
-
138
-
139
-
140
-
141
-
142
 |
 |

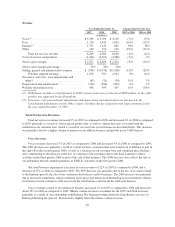
The following is a summary of our average subscribers and average revenue per subscriber for the years
ended December 31, 2007, 2006 and 2005. The number of subscribers impacts service revenues, cost of service
and bad debt expense, as well as support costs, such as customer care and billing, which are included in general
and administrative expenses. A summary of changes in net additions to subscribers and average monthly revenue
per subscriber for each of the last three years may be found on pages 38 and 39.
Year Ended December 31, Change from Previous Year
2007 2006 2005 2007 vs 2006 2006 vs 2005
(subscribers in thousands)
Average post-paid subscribers(1)(2) ................. 41,454 40,319 25,185 1,135 15,134
Average prepaid subscribers ..................... 4,391 3,461 829 930 2,632
Average monthly service revenue per user:
Direct post-paid ........................... $ 59 $ 61 $ 63 $ (2) $ (2)
Direct prepaid ............................ 30 33 37 (3) (4)
Average direct post and prepaid .............. 56 59 62 (3) (3)
(1) Average subscribers represent the weighted average number of direct subscribers included in our customer
base during the period, including subscribers added through acquisitions, net of deactivated subscribers.
(2) The average subscribers for the year ended December 31, 2007 are inclusive of 170,000 subscribers
acquired through our 2007 acquisition of Northern PCS, compared to 4,156,000 subscribers acquired
through our 2006 acquisitions of certain PCS Affiliates and Nextel Partners, and 17,989,000 and 860,000
subscribers acquired through the 2005 Sprint-Nextel merger and the acquisitions of certain PCS Affiliates.
Service revenues decreased $15 million or less than 1% in 2007 as compared to 2006, due to:
• a decrease of approximately $220 million in service revenue from our direct post-paid subscribers. This
decrease is due primarily to a decline in average monthly service revenue per post-paid user,
attributable to a decrease in the average monthly voice revenue per post-paid user, which is only
partially offset by an increase in the average monthly data revenue per post-paid user. This decline is
partially offset by an increase in revenue attributable to the increase in the weighted average number of
direct post-paid subscribers;
offset by
• a net increase of approximately $205 million in service revenue from our prepaid subscribers. This
increase is due primarily to an increase in the average number of direct prepaid subscribers, partially
offset by a decline in average monthly service revenue per prepaid subscriber.
Service revenues increased $11.8 billion or 61% in 2006 as compared to 2005, due to:
• a net increase of approximately $10.8 billion in service revenue from our direct post-paid subscribers,
due primarily to an increase in the average number of direct post-paid subscribers, most of which were
acquired in the Sprint-Nextel merger; and
• a net increase of approximately $1.0 billion in service revenue from our prepaid subscribers, due
primarily to an increase in the average number of direct prepaid subscribers, most of which were
acquired in the Sprint-Nextel merger.
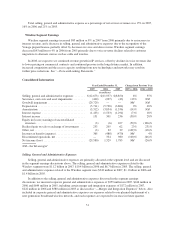
The net increase in post-paid subscribers is a function of several factors. We believe that other than the
subscribers acquired through business combinations, new subscribers are attracted to our differentiated products
and services, particularly CDMA-based data-related services, including those available under our Sprint Power
Vision service plans, and other non-voice services. Within our existing customer base in 2007, 1.6 million
45