Sprint - Nextel 2007 Annual Report Download - page 55
Download and view the complete annual report
Please find page 55 of the 2007 Sprint - Nextel annual report below. You can navigate through the pages in the report by either clicking on the pages listed below, or by using the keyword search tool below to find specific information within the annual report.-
 1
1 -
2
-
3
-
4
-
5
-
6
-
7
-
8
-
9
-
10
-
11
-
12
-
13
-
14
-
15
-
16
-
17
-
18
-
19
-
20
-
21
-
22
-
23
-
24
-
25
-
26
-
27
-
28
-
29
-
30
-
31
-
32
-
33
-
34
-
35
-
36
-
37
-
38
-
39
-
40
-
41
-
42
-
43
-
44
-
 45
45 -
 46
46 -
 47
47 -
 48
48 -
 49
49 -
 50
50 -
 51
51 -
 52
52 -
 53
53 -
 54
54 -
 55
55 -
 56
56 -
 57
57 -
 58
58 -
 59
59 -
 60
60 -
 61
61 -
 62
62 -
 63
63 -
 64
64 -
 65
65 -
66
-
67
-
68
-
69
-
70
-
71
-
72
-
73
-
74
-
75
-
76
-
77
-
78
-
79
-
80
-
81
-
82
-
83
-
84
-
85
-
86
-
87
-
88
-
89
-
90
-
91
-
92
-
93
-
94
-
95
-
96
-
97
-
98
-
99
-
100
-
101
-
102
-
103
-
104
-
105
-
106
-
107
-
108
-
109
-
110
-
111
-
112
-
113
-
114
-
115
-
116
-
117
-
118
-
119
-
120
-
121
-
122
-
123
-
124
-
125
-
126
-
127
-
128
-
129
-
130
-
131
-
132
-
133
-
134
-
135
-
136
-
137
-
138
-
139
-
140
-
141
-
142
 |
 |
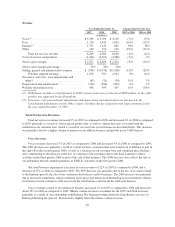
Interest Expense
Interest expense in 2007 decreased 7% as compared to 2006, primarily reflecting the reduction in our
average debt balance. The effective interest rate on our average long-term debt balance of $21.8 billion in 2007
was 6.9%, unchanged from 2006 based on an average long-term debt balance of $23.2 billion. The effective
interest rate includes the effect of interest rate swap agreements. As of December 31, 2007, the average floating
rate of interest on the interest rate swaps was 8.0%, while the weighted average coupon on the underlying debt
was 7.2%. See “—Liquidity and Capital Resources” for more information on our financing activities.
Interest Income
Interest income includes dividends received from certain investments in equity securities and interest earned
on marketable debt securities and cash equivalents. In 2007, interest income decreased 50%, as compared to
2006, primarily due to a decrease in the average commercial paper held, as well as a decrease in the average
temporary cash investments balance. In 2006, interest income increased 28% as compared to 2005, primarily due
to the higher interest rates on the cash equivalents balances as well as interest income recognized in relation to a
favorable tax audit settlement for the years 1995 to 2002. The 2006 increase was partially offset by the decrease
in cash investment balances due to debt retirements, purchases of common stock and acquisitions.
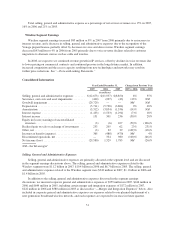
Equity in Earnings (Losses) of Unconsolidated Investees, net
Under the equity method of accounting, we record our proportional share of the earnings or losses of the
companies in which we have invested and have the ability to exercise significant influence over, up to the amount
of our investment in the case of losses. We recorded $3 million of equity method losses during 2007. We
recorded $6 million of equity method losses during 2006, primarily due to our ownership interests in E-wireless.
We recorded $107 million of equity method earnings in 2005 primarily related to Nextel Partners.
Realized Gain on Sale or Exchange of Investments
During 2007, we recognized a gain from the sale of investments of $253 million, primarily due to a pre-tax
gain of $240 million related to the sale of a portion of our equity interest in Virgin Mobile USA, LLC, or VMU.
See note 1 of the Notes to Consolidated Financial Statements for more information.
During 2006, we recognized a gain from the sale of investments of $205 million, primarily due to
$433 million of gains on the sales of our investment in NII Holdings, Inc., partially offset by a loss of
$274 million from the change in fair value of an option contract associated with our investment in NII Holdings,
as described in note 9 of the Notes to Consolidated Financial Statements.
We recognized a gain of $62 million from the sale of investments in 2005, which primarily consisted of
gains related to our investments in Call-Net Enterprises, Inc., NII Holdings and Earthlink, Inc.
Other, net
Other, net consists mainly of gain/loss on early retirement of debt and other miscellaneous income/expense.
Income Tax Benefit (Expense)
Our consolidated effective tax rates were 1.2% in 2007, 32.9% in 2006 and 36.4% in 2005. The 2007
effective tax rate was impacted by $29.3 billion of the $29.7 billion non-cash impairment charge related to
goodwill as substantially all of the charge is not separately deductible for tax purposes and a $105 million benefit
related to state income tax law changes. Information regarding the items that caused the effective income tax
rates to vary from the statutory federal rate for income taxes related to continuing operations can be found in
note 7 of the Notes to Consolidated Financial Statements.
53