Starbucks 2004 Annual Report Download - page 10
Download and view the complete annual report
Please find page 10 of the 2004 Starbucks annual report below. You can navigate through the pages in the report by either clicking on the pages listed below, or by using the keyword search tool below to find specific information within the annual report.-
 1
1 -
 2
2 -
 3
3 -
 4
4 -
 5
5 -
 6
6 -
 7
7 -
 8
8 -
 9
9 -
 10
10 -
 11
11 -
 12
12 -
 13
13 -
 14
14 -
 15
15 -
 16
16 -
 17
17 -
 18
18 -
 19
19 -
 20
20 -
 21
21 -
22
-
23
-
24
-
25
-
26
-
27
-
28
-
29
-
30
-
31
-
32
-
33
 |
 |
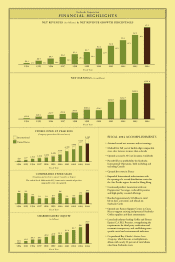
Fiscal 2004 Annual Report 21
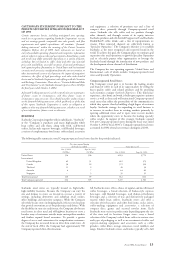
Torrefazione Italia stores.
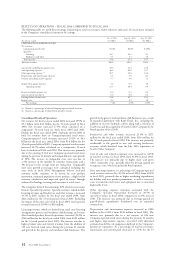
The Company derived the remaining 15% of total net revenues
from its Specialty Operations. Specialty revenues, which include
licensing revenues and foodservice and other revenues, increased
$129.9 million, or 26.2%, to $625.9 million for the fi scal year
ended 2003, from $496.0 million for the corresponding fi scal
2002 period.
Licensing revenues, which are derived from retail store
licensing arrangements, grocery and warehouse club licensing
and certain other branded-product licensed operations,
increased 31.3% to $409.6 million for the fi scal year ended
2003, from $311.9 million for the corresponding fi scal 2002
period. The increase was due to higher product sales and
royalty revenues from opening 599 new licensed retail stores
during the previous 12 months and growth in the licensed
grocery and warehouse club businesses.
Foodservice and other revenues increased 17.5% to $216.3
million for the fi scal year ended 2003, from $184.1 million
for the corresponding fi scal 2002 period. The increase was
primarily attributable to broader distribution and growth in
new and existing foodservice accounts.
Cost of sales and related occupancy costs increased to 41.4%
of total net revenues in fi scal 2003, from 41.0% in fi scal 2002.
The increase was primarily due to higher green coffee costs
and a shift in specialty revenue mix to lower margin products.
The Company’s green coffee costs reached a historic low for
Starbucks in the second and third fi scal quarters of 2002 and
have gradually increased since then. These increases were
partially offset by leverage gained on fi xed occupancy costs
distributed over an expanded revenue base.
Store operating expenses as a percentage of Company-operated
retail revenues increased to 40.0% in fi scal 2003, from 39.7%
in fi scal 2002, primarily due to higher payroll-related and
advertising expenditures. Payroll-related costs have increased
primarily due to an increase in the number of partners eligible
to participate in the Company’s medical and vacation benefi ts.
Advertising expenditures increased in fi scal 2003 due to
promotions for new and existing products. These increases
were partially offset by lower provisions for asset impairment
for International Company-operated retail stores in 2003 as
compared to the prior year.
Other operating expenses (expenses associated with the
Company’s Specialty Operations) were 22.6% of specialty
revenues in fi scal 2003, compared to 21.4% in fi scal 2002,
primarily due to higher payroll-related expenditures to support
the continued development of the Company’s foodservice
distribution network and international infrastructure, including
regional offi ces and fi eld personnel.
Depreciation and amortization expenses increased to $237.8
million in fi scal 2003, from $205.6 million in fi scal 2002,
primarily due to opening 602 Company-operated retail stores
during the previous 12 months and the refurbishment of
existing Company-operated retail stores.
General and administrative expenses increased to $244.6 million
in fi scal 2003, compared to $234.6 million in fi scal 2002, which
included an $18.0 million charge for the litigation settlement of
two California class action lawsuits. Excluding the litigation
charge, general and administrative expenses increased $28.0
million from the comparable fi scal 2002 period due to higher
payroll-related expenditures and costs related to the acquisition
of Seattle Coffee Company. General and administrative
expenses as a percentage of total net revenues decreased to 6.0%
in fi scal 2003, compared to 7.1% in fi scal 2002.
Operating income increased 34.3% to $424.7 million in fi scal
2003, from $316.3 million in fi scal 2002. The operating margin
increased to 10.4% of total net revenues in fi scal 2003, compared
to 9.6% in fi scal 2002, primarily due to leverage gained on fi xed
costs distributed over an expanding revenue base, partially offset
by higher green coffee costs, as discussed above.
Income from equity investees was $38.4 million in fi scal
2003, compared to $33.4 million in fi scal 2002. The increase
was mainly attributable to continued strong results by The
North American Coffee Partnership, the Company’s 50%-
owned partnership with the Pepsi-Cola Company, from
expanded ready-to-drink product lines, lower direct costs and
manufacturing effi ciencies. Partially offsetting this increase
was the Company’s proportionate share of the net losses of
Starbucks Japan in fi scal 2003, compared to a net profi t in fi scal
2002, primarily due to lower average sales per store.
Net interest and other income, which primarily consists of
interest income, increased to $11.6 million in fi scal 2003, from
$9.3 million in fi scal 2002. The growth was a result of increased
interest received on higher balances of cash, cash equivalents
and liquid securities during fi scal 2003, compared to the prior
year, as well as gains realized on market revaluations of the
Company’s trading securities, compared to realized losses on
this portfolio in the prior year.
The Company’s effective tax rate for fi scal 2003 was 38.5%
compared to 37.3% in fi scal 2002, as a result of a shift in the
composition of the Company’s pretax earnings in fi scal 2003.
Operations taxed in the United States had higher pretax earnings
and International operations generated greater nondeductible
losses during fi scal 2003 than during fi scal 2002.