Starbucks 2004 Annual Report Download - page 15
Download and view the complete annual report
Please find page 15 of the 2004 Starbucks annual report below. You can navigate through the pages in the report by either clicking on the pages listed below, or by using the keyword search tool below to find specific information within the annual report.-
 1
1 -
2
-
3
-
4
-
 5
5 -
 6
6 -
 7
7 -
 8
8 -
 9
9 -
 10
10 -
 11
11 -
 12
12 -
 13
13 -
 14
14 -
 15
15 -
 16
16 -
 17
17 -
 18
18 -
 19
19 -
 20
20 -
 21
21 -
 22
22 -
 23
23 -
 24
24 -
 25
25 -
26
-
27
-
28
-
29
-
30
-
31
-
32
-
33
 |
 |

26 Fiscal 2004 Annual Report
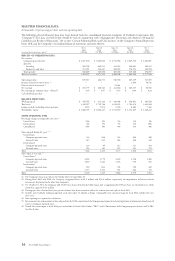
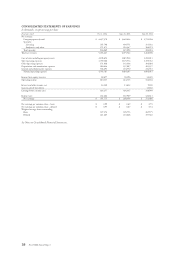
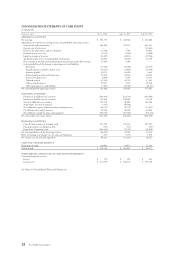
CONSOLIDATED STATEMENTS OF EARNINGS
In thousands, except earnings per share
Fiscal year ended Oct 3, 2004 Sept 28, 2003 Sept 29, 2002
Net revenues:
Company-operated retail $ 4,457,378 $ 3,449,624 $ 2,792,904
Specialty:
Licensing 565,798 409,551 311,932
Foodservice and other 271,071 216,347 184,072
Total specialty 836,869 625,898 496,004
Total net revenues 5,294,247 4,075,522 3,288,908
Cost of sales including occupancy costs 2,198,654 1,685,928 1,350,011
Store operating expenses 1,790,168 1,379,574 1,109,782
Other operating expenses 171,648 141,346 106,084
Depreciation and amortization expenses 280,024 237,807 205,557
General and administrative expenses 304,293 244,550 234,581
Subtotal operating expenses 4,744,787 3,689,205 3,006,015
Income from equity investees 60,657 38,396 33,445
Operating income 610,117 424,713 316,338
Interest and other income, net 14,140 11,622 9,300
Gain on sale of investment – – 13,361
Earnings before income taxes 624,257 436,335 338,999
Income taxes 232,482 167,989 126,313
Net earnings $ 391,775 $ 268,346 $ 212,686
Net earnings per common share – basic $ 0.99 $ 0.69 $ 0.55
Net earnings per common share – diluted $ 0.95 $ 0.67 $ 0.54
Weighted average shares outstanding:
Basic 397,173 390,753 385,575
Diluted 411,465 401,648 397,526
See Notes to Consolidated Financial Statements.