Starbucks 2004 Annual Report Download - page 17
Download and view the complete annual report
Please find page 17 of the 2004 Starbucks annual report below. You can navigate through the pages in the report by either clicking on the pages listed below, or by using the keyword search tool below to find specific information within the annual report.-
 1
1 -
2
-
3
-
4
-
5
-
6
-
 7
7 -
 8
8 -
 9
9 -
 10
10 -
 11
11 -
 12
12 -
 13
13 -
 14
14 -
 15
15 -
 16
16 -
 17
17 -
 18
18 -
 19
19 -
 20
20 -
 21
21 -
 22
22 -
 23
23 -
 24
24 -
 25
25 -
 26
26 -
 27
27 -
28
-
29
-
30
-
31
-
32
-
33
 |
 |

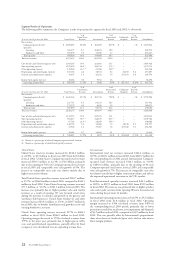
28 Fiscal 2004 Annual Report
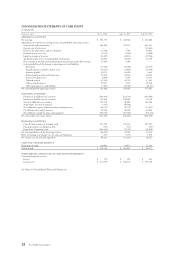
CONSOLIDATED STATEMENTS OF CASH FLOWS
In thousands
Fiscal year ended Oct 3, 2004 Sept 28, 2003 Sept 29, 2002
OPERATING ACTIVITIES
Net earnings $ 391,775 $ 268,346 $ 212,686
Adjustments to reconcile net earnings to net cash provided by operating activities:
Depreciation and amortization 304,820 259,271 221,141
Gain on sale of investment – – (13,361)
Provision for impairments and asset disposals 13,568 7,784 26,852
Deferred income taxes, net (3,073) (5,932) (6,088)
Equity in income of investees (33,387) (22,813) (19,584)
Tax benefit from exercise of nonqualified stock options 63,405 36,590 44,199
Net accretion of discount and amortization of premium on marketable securities 11,603 5,996 –
Cash provided/(used) by changes in operating assets and liabilities:
Inventories (77,662) (64,768) (41,379)
Prepaid expenses and other current assets (16,621) (12,861) (12,460)
Accounts payable 20,175 24,990 5,463
Accrued compensation and related costs 54,929 42,132 24,087
Accrued occupancy costs 8,900 4,293 15,343
Deferred revenue 47,590 30,732 15,321
Other accrued expenses 15,027 9,471 31,900
Other operating assets and liabilities (7,201) (16,784) (26,435)
Net cash provided by operating activities 793,848 566,447 477,685
INVESTING ACTIVITIES
Purchase of available-for-sale securities (566,645) (323,331) (339,968)
Maturity of available-for-sale securities 163,814 180,687 78,349
Sale of available-for-sale securities 190,748 88,889 144,760
Acquisitions, net of cash acquired (7,515) (69,928) –
Net additions to equity, other investments and other assets (64,747) (47,259) (15,841)
Distributions from equity investees 38,328 28,966 22,834
Net additions to property, plant and equipment (386,176) (357,282) (375,474)
Net cash used by investing activities (632,193) (499,258) (485,340)
FINANCING ACTIVITIES
Proceeds from issuance of common stock 137,590 107,183 107,467
Principal payments on long-term debt ,(722) ,(710) ,(697)
Repurchase of common stock (203,413) (75,710) (52,248)
Net cash provided/(used) by financing activities (66,545) 30,763 54,522
Effect of exchange rate changes on cash and cash equivalents 3,111 3,278 1,560
Net increase in cash and cash equivalents 98,221 101,230 48,427
CASH AND CASH EQUIVALENTS
Beginning of period 200,907 99,677 51,250
End of period $ 299,128 $ 200,907 $ 99,677
SUPPLEMENTAL DISCLOSURE OF CASH FLOW INFORMATION
Cash paid during the year for:
Interest $ ,370 $ ,265 $ ,303
Income taxes $ 172,759 $ 140,107 $ 105,339
See Notes to Consolidated Financial Statements.