Starbucks 2004 Annual Report Download - page 28
Download and view the complete annual report
Please find page 28 of the 2004 Starbucks annual report below. You can navigate through the pages in the report by either clicking on the pages listed below, or by using the keyword search tool below to find specific information within the annual report.-
 1
1 -
2
-
3
-
4
-
5
-
6
-
7
-
8
-
9
-
10
-
11
-
12
-
13
-
14
-
15
-
16
-
17
-
 18
18 -
 19
19 -
 20
20 -
 21
21 -
 22
22 -
 23
23 -
 24
24 -
 25
25 -
 26
26 -
 27
27 -
 28
28 -
 29
29 -
 30
30 -
 31
31 -
 32
32 -
 33
33
 |
 |

Fiscal 2004 Annual Report 39
$0.7 million and $0.7 million during fi scal years 2004, 2003 and
2002, respectively, for team sponsorships and ticket purchases.
Terms of the team sponsorship agreements did not change as a
result of the related party relationship.
Prior to January 2003, a former member of the Company’s Board
of Directors served as a board member of, and owned an indirect
interest in, a privately held company that provides Starbucks
with in-store music services. Starbucks paid $0.7 million and
$3.0 million to the privately held company for music services
during fi scal years 2003 and 2002, respectively, while the related
party relationship existed.
Note 17: Commitments and Contingencies
The Company has unconditionally guaranteed the repayment
of certain Japanese yen–denominated bank loans and related
interest and fees of an unconsolidated equity investee,
Starbucks Coffee Japan, Ltd. The guarantees continue until
the loans, including accrued interest and fees, have been
paid in full. The maximum amount is limited to the sum of
unpaid principal and interest amounts, as well as other related
expenses. These amounts will vary based on fl uctuations in
the yen foreign exchange rate. As of October 3, 2004, the
maximum amount of the guarantees was approximately
$10.6 million. Since there has been no modifi cation of these
loan guarantees subsequent to the Company’s adoption of
FASB Interpretation No. 45, “Guarantor’s Accounting
and Disclosure Requirements for Guarantees, Including
Indebtedness of Others,” Starbucks has applied the disclosure
provisions only and has not recorded the guarantee in its
statement of fi nancial position.
Coffee brewing and espresso equipment sold to customers
through Company-operated and licensed retail stores, as well
as equipment sold to the Company’s licensees for use in retail
licensing operations, are under warranty for defects in materials
and workmanship for a period ranging from 12 to 24 months.
The Company establishes an accrual for estimated warranty
costs at the time of sale, based on historical experience.
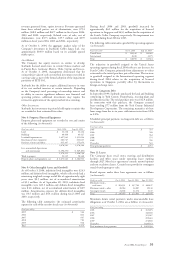
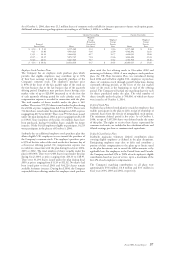
The following table summarizes the activity related to
product warranty reserves during fi scal years 2004 and 2003
(in thousands):
Fiscal year ended Oct 3, 2004 Sept 28, 2003
Balance at beginning of fiscal year $ 2,227 $ 1,842
Provision for warranties issued 5,093 2,895
Warranty claims (4,229 ) (2,510 )
Balance at end of fiscal year $ 3,091 $ 2,227
The Company is party to various legal proceedings arising in
the ordinary course of its business, but it is not currently a party
to any legal proceeding that management believes would have a
material adverse effect on the consolidated fi nancial position or
results of operations of the Company.
Note 18: Subsequent Event
In November 2004, Starbucks increased its equity ownership
from 18% to 100% for its licensed operations in Germany. For
these operations, management determined that a change in
accounting method, from the cost method to the consolidation
method, will be required. This accounting change will include
adjusting previously reported information for the Company’s
proportionate share of net losses of 18% as required by
APB Opinion No. 18, “The Equity Method of Accounting for
Investments in Common Stock,” in the Company’s fi scal fi rst
quarter of 2005.
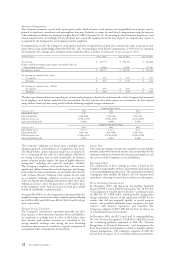
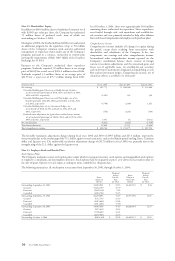
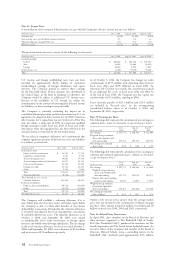
As shown in the table below, the cumulative effect of the accounting change for fi nancial results previously reported under the cost
method will result in reductions of net earnings of $1.3 million, $1.4 million and $0.9 million for the fi scal years ended October 3,
2004, September 28, 2003, and September 29, 2002, respectively (in thousands, except earnings per share):
Oct 3, Sept 28, Sept 29,
Fiscal year ended 2004 2003 2002
Net earnings, previously reported $ 391,775 $ 268,346 $ 212,686
Effect of change to equity method (1,287 ) (1,355 ) (928 )
Net earnings, as restated $ 390,488 $ 266,991 $ 211,758
Net earnings per common share – basic:
Previously reported $ 0.99 $ 0.69 $ 0.55
As restated $ 0.98 $ 0.68 $ 0.55
Net earnings per common share – diluted:
Previously reported $ 0.95 $ 0.67 $ 0.54
As restated $ 0.95 $ 0.66 $ 0.53
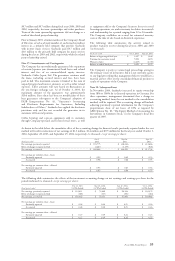
The following table summarizes the effects of the investment accounting change on net earnings and earnings per share for the
periods indicated (in thousands, except earnings per share):
Dec 28, 2003 Mar 28, 2004 Jun 27, 2004 Oct 3, 2004
Fiscal period ended (13 Wks Ended) (13 Wks Ended) (13 Wks Ended) (14 Wks Ended)
Net earnings, previously reported $ 110,811 $ 79,488 $ 98,104 $ 103,372
Effect of change to equity method (368) (337) (296) (286)
Net earnings, as restated $ 110,443 $ 79,151 $ 97,808 $ 103,086
Net earnings per common share – basic:
Previously reported $ 0.28 $ 0.20 $ 0.25 $ 0.26
As restated $ 0.28 $ 0.20 $ 0.25 $ 0.26
Net earnings per common share – diluted:
Previously reported $ 0.27 $ 0.19 $ 0.24 $ 0.25
As restated $ 0.27 $ 0.19 $ 0.24 $ 0.25