Starbucks 2004 Annual Report Download - page 25
Download and view the complete annual report
Please find page 25 of the 2004 Starbucks annual report below. You can navigate through the pages in the report by either clicking on the pages listed below, or by using the keyword search tool below to find specific information within the annual report.-
 1
1 -
2
-
3
-
4
-
5
-
6
-
7
-
8
-
9
-
10
-
11
-
12
-
13
-
14
-
 15
15 -
 16
16 -
 17
17 -
 18
18 -
 19
19 -
 20
20 -
 21
21 -
 22
22 -
 23
23 -
 24
24 -
 25
25 -
 26
26 -
 27
27 -
 28
28 -
 29
29 -
 30
30 -
 31
31 -
 32
32 -
 33
33
 |
 |

36 Fiscal 2004 Annual Report
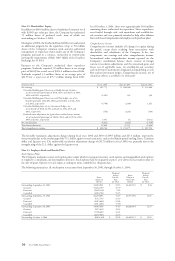
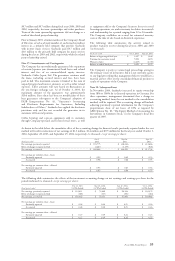
Note 12: Shareholders’ Equity
In addition to 600.0 million shares of authorized common stock
with $0.001 par value per share, the Company has authorized
7.5 million shares of preferred stock, none of which was
outstanding at October 3, 2004.
During fi scal 2004, the Starbucks Board of Directors authorized
an additional program for the repurchase of up to 9.0 million
shares of the Company’s common stock and also authorized
management to repurchase shares under any of the Company’s
programs pursuant to a contract, instruction or written plan
meeting the requirements of Rule 10b5-1(c)(1) of the Securities
Exchange Act of 1934.
Pursuant to the Company’s authorized share repurchase
programs, Starbucks acquired 5.0 million shares at an average
price of $40.85 for a total cost of $203.4 million in fi scal 2004.
Starbucks acquired 3.3 million shares at an average price of
$22.95 for a total cost of $75.7 million during fi scal 2003.
As of October 3, 2004, there were approximately 18.6 million
remaining shares authorized for repurchase. Share repurchases
were funded through cash, cash equivalents and available-for-
sale securities and were primarily intended to help offset dilution
from stock-based compensation and employee stock purchase plans.
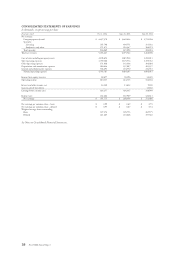
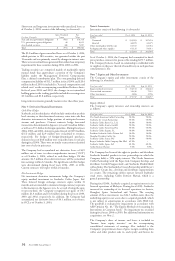
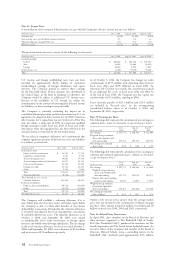
Comprehensive Income
Comprehensive income includes all changes in equity during
the period, except those resulting from transactions with
shareholders and subsidiaries of the Company. It has two
components: net earnings and other comprehensive income.
Accumulated other comprehensive income reported on the
Company’s consolidated balance sheets consists of foreign
currency translation adjustments and the unrealized gains and
losses, net of applicable taxes, on available-for-sale securities
and on derivative instruments designated and qualifying as cash
fl ow and net investment hedges. Comprehensive income, net of
related tax effects, is as follows (in thousands):
Fiscal year ended Oct 3, 2004 Sept 28, 2003 Sept 29, 2002
Net earnings $ 391,775 $ 268,346 $ 212,686
Unrealized holding gains/(losses) on available-for-sale securities,
net of tax benefit/(provision) of $618, ($53) and ($231) in 2004,
2003 and 2002, respectively (1,005) ,142 ,394
Unrealized holding gains/(losses) on cash flow hedges, net of tax
benefit/(provision) of $2,801, $804 and ($1,066) in 2004, 2003
and 2002, respectively (4,769) (1,369) 1,815
Unrealized holding losses on net investment hedges, net
of tax benefit of $328, $1,903 and $415 in 2004, 2003 and
2002, respectively ,(558) (3,241) ,(706)
Reclassification adjustment for (gains)/losses realized in net income,
net of tax benefit/(provision) of ($832), ($41) and $1,769 in 2004,
2003 and 2002, respectively 1,407 , 42 (3,012)
Net unrealized loss (4,925) (4,426) (1,509)
Translation adjustment 19,896 27,255 (1,664)
Total comprehensive income $ 406,746 $ 291,175 $ 209,513
The favorable translation adjustment changes during fi scal years 2004 and 2003 of $19.9 million and $27.3 million, respectively,
were primarily due to the weakening of the U.S. dollar against several currencies, such as the British pound sterling, Euro, Canadian
dollar and Japanese yen. The unfavorable translation adjustment change of ($1.7) million in fi scal 2002 was primarily due to the
strengthening of the U.S. dollar against the Japanese yen.
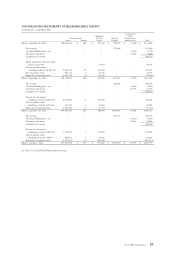
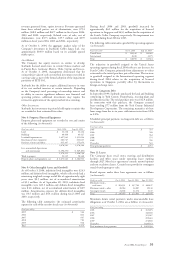
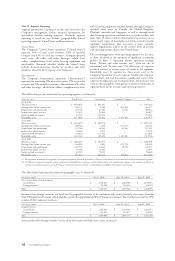
Note 13: Employee Stock and Benefi t Plans
Stock Option Plans
The Company maintains several stock option plans under which it may grant incentive stock options and nonqualifi ed stock options
to employees, consultants and nonemployee directors. Stock options have been granted at prices at or above the fair market value on
the date of grant. Options vest and expire according to terms established at the grant date.
The following summarizes all stock option transactions from September 30, 2001, through October 3, 2004:
Weighted Weighted
Average Shares Average
Shares Exercise Subject to Exercise
Subject to Price Exercisable Price
Options per Share Options per Share
Outstanding, September 30, 2001 43,010,931 $ 12.13 24,407,135 $ 9.16
Granted 10,262,709 15.79
Exercised (9,830,136 ) 9.29
Cancelled (2,983,701 ) 15.15
Outstanding, September 29, 2002 40,459,803 13.55 20,975,598 11.07
Granted 9,537,730 21.10
Exercised (8,019,604 ) 11.69
Cancelled (2,912,483 ) 17.90
Outstanding, September 28, 2003 39,065,446 15.47 20,888,694 12.55
Granted 9,217,620 31.23
Exercised (7,708,491 ) 14.21
Cancelled (2,157,965 ) 23.75
Outstanding, October 3, 2004 38,416,610 $ 19.05 26,689,115 $ 15.85