Starbucks 2004 Annual Report Download - page 21
Download and view the complete annual report
Please find page 21 of the 2004 Starbucks annual report below. You can navigate through the pages in the report by either clicking on the pages listed below, or by using the keyword search tool below to find specific information within the annual report.-
 1
1 -
2
-
3
-
4
-
5
-
6
-
7
-
8
-
9
-
10
-
 11
11 -
 12
12 -
 13
13 -
 14
14 -
 15
15 -
 16
16 -
 17
17 -
 18
18 -
 19
19 -
 20
20 -
 21
21 -
 22
22 -
 23
23 -
 24
24 -
 25
25 -
 26
26 -
 27
27 -
 28
28 -
 29
29 -
 30
30 -
 31
31 -
32
-
33
 |
 |

32 Fiscal 2004 Annual Report
Stock-based Compensation
The Company maintains several stock option plans under which incentive stock options and nonqualifi ed stock options may be
granted to employees, consultants and nonemployee directors. Starbucks accounts for stock-based compensation using the intrinsic
value method prescribed in Accounting Principles Board (“APB”) Opinion No. 25, “Accounting for Stock Issued to Employees,” and
related interpretations. Accordingly, because the grant price equals the market price on the date of grant, no compensation expense is
recognized by the Company for stock options issued to employees.
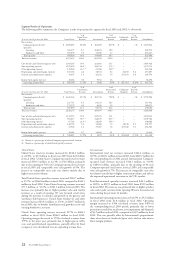
If compensation cost for the Company’s stock options had been recognized based upon the estimated fair value on the grant date
under the fair value methodology allowed by SFAS No. 123, “Accounting for Stock-Based Compensation,” (“SFAS 123”) as amended,
the Company’s net earnings and earnings per share would have been as follows (in thousands, except earnings per share):
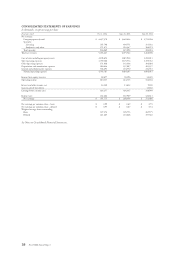
Fiscal year ended Oct 3, 2004 Sept 28, 2003 Sept 29, 2002
Net earnings $ 391,775 $ 268,346 $ 212,686
Deduct: stock-based compensation expense determined under fair
value method, net of tax 45,056 37,436 37,447
Pro forma net income $ 346,719 $ 230,910 $ 175,239
Net earnings per common share – basic:
As reported $ 0.99 $ 0.69 $ 0.55
Pro forma $ 0.87 $ 0.59 $ 0.45
Net earnings per common share – diluted
As reported $ 0.95 $ 0.67 $ 0.54
Pro forma $ 0.85 $ 0.58 $ 0.44
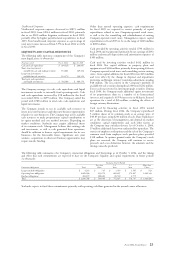
The above pro forma information regarding net income and earnings per share has been determined as if the Company had accounted
for its employee stock options under the fair value method. The fair value for these stock options was estimated at the date of grant
using a Black-Scholes option pricing model with the following weighted average assumptions:
Employee Stock Options
Fiscal year ended 2004 2003 2002
Expected life (years) 1–6 2–5 2–5
Expected volatility 22%–50% 37%–55% 43%–54%
Risk-free interest rate 1.10%–4.52% 0.92%–4.01% 1.63%–4.96%
Expected dividend yield 0.00% 0.00% 0.00%
Employee Stock Purchase Plans
Fiscal year ended 2004 2003 2002
Expected life (years) 0.25–3 0.25–3 0.25
Expected volatility 19%–43% 30%–50% 33%–51%
Risk-free interest rate 0.93%–2.3% 0.87%–2.25% 1.93%–2.73%
Expected dividend yield 0.00% 0.00% 0.00%
The Company’s valuations are based upon a multiple option
valuation approach, and forfeitures are recognized as they occur.
The Black-Scholes option valuation model was developed for
use in estimating the fair value of traded options, which have
no vesting restrictions and are fully transferable. In addition,
option valuation models require the input of highly subjective
assumptions, including the expected stock-price volatility.
The Company’s employee stock options have characteristics
signifi cantly different from those of traded options, and changes
in the subjective input assumptions can materially affect the fair
value estimate. Because Company stock options do not trade
on a secondary exchange, employees can receive no value nor
derive any benefi t from holding stock options under these plans
without an increase, above the grant price, in the market price
of the Company’s stock. Such an increase in stock price would
benefi t all stockholders commensurately.
As required by SFAS 123, the Company has determined that the
weighted average estimated fair values of options granted during
fi scal 2004, 2003 and 2002 were $10.60, $8.31 and $6.48 per
share, respectively.
Foreign Currency Translation
The Company’s international operations generally use their
local currency as their functional currency. Assets and liabilities
are translated at exchange rates in effect at the balance sheet
date. Income and expense accounts are translated at the
average monthly exchange rates during the year. Resulting
translation adjustments are recorded as a separate component of
accumulated other comprehensive income/(loss).
Income Taxes
The Company computes income taxes using the asset and liability
method, under which deferred income taxes are provided for the
temporary differences between the fi nancial reporting basis and
the tax basis of the Company’s assets and liabilities.
Earnings per Share
The computation of basic earnings per share is based on the
weighted average number of shares and common stock units that
were outstanding during the period. The computation of diluted
earnings per share includes the dilutive effect of common stock
equivalents consisting of certain shares subject to stock options.
Recent Accounting Pronouncements
In December 2003, the Financial Accounting Standards
Board (“FASB”) issued FASB Interpretation No. 46 Revised,
“Consolidation of Variable Interest Entities – an Interpretation
of ARB No. 51” (“FIN 46R”), which provided, among other
things, immediate deferral of the application of FIN 46 for
entities that did not originally qualify as special purpose
entities, and provided additional scope exceptions for joint
ventures with business operations and franchises. The
Company’s adoption of FIN 46R did not have an impact on
its consolidated fi nancial statements.
In December 2003, the SEC issued Staff Accounting Bulletin
No. 104, “Revenue Recognition” (“SAB 104”). SAB 104 rescinds
the accounting guidance contained in SAB 101, “Revenue
Recognition in Financial Statements,” and incorporates the
body of previously issued guidance related to multiple-element
revenue arrangements. The Company’s adoption of SAB 104
did not have an impact on its consolidated fi nancial statements.