Starbucks 2004 Annual Report Download - page 8
Download and view the complete annual report
Please find page 8 of the 2004 Starbucks annual report below. You can navigate through the pages in the report by either clicking on the pages listed below, or by using the keyword search tool below to find specific information within the annual report.-
 1
1 -
 2
2 -
 3
3 -
 4
4 -
 5
5 -
 6
6 -
 7
7 -
 8
8 -
 9
9 -
 10
10 -
 11
11 -
 12
12 -
 13
13 -
 14
14 -
 15
15 -
 16
16 -
 17
17 -
 18
18 -
 19
19 -
20
-
21
-
22
-
23
-
24
-
25
-
26
-
27
-
28
-
29
-
30
-
31
-
32
-
33
 |
 |

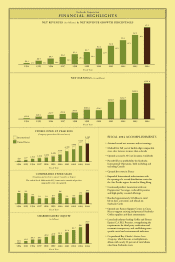
Fiscal 2004 Annual Report 19
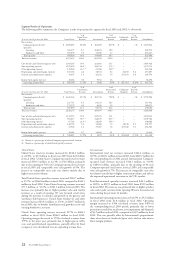
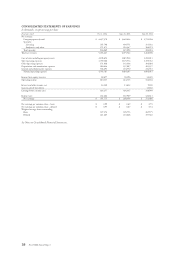
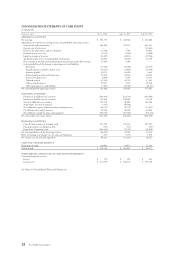
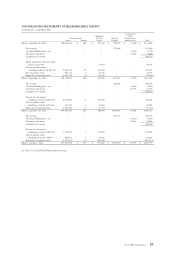
Operating Segments
Segment information is prepared on the same basis that the Company’s management reviews fi nancial information for operational
decision-making purposes.
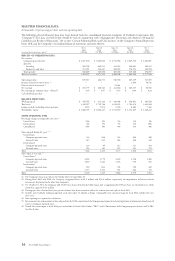
The following tables summarize the Company’s results of operations by segment for fi scal 2004 and 2003 (in thousands):
% of % of % of
United States International Unallocated Total Net
53 weeks ended October 3, 2004 United States Revenue International Revenue Corporate Revenue Consolidated
Net revenues:
Company-operated retail $ 3,800,367 84.6% $ 657,011 81.8% $ – – % $ 4,457,378
Specialty:
Licensing 436,981 9.7 128,817 16.0 – – 565,798
Foodservice and other 253,502 5.7 17,569 2.2 – – 271,071
Total specialty 690,483 15.4 146,386 18.2 – – 836,869
Total net revenues 4,490,850 100.0 803,397 100.0 – – 5,294,247
Cost of sales and related occupancy costs 1,789,502 39.8 409,152 50.9 – – 2,198,654
Store operating expenses 1,546,871 40.7 (1) 243,297 37.0
(1) – – 1,790,168
Other operating expenses 144,853 21.0 (2) 26,795 18.3
(2) – – 171,648
Depreciation and amortization expenses 201,703 4.5 45,783 5.7 32,538 0.6 280,024
General and administrative expenses 80,221 1.8 48,206 6.0 175,866 3.3 304,293
Income from equity investees 37,453 0.8 23,204 2.9 – – 60,657
Operating income/(loss) $ 765,153 17.0% $ 53,368 6.6% $ (208,404) (3.9)% $ 610,117
% of % of % of
United States International Unallocated Total Net
52 weeks ended September 28, 2003 United States Revenue International Revenue Corporate Revenue Consolidated
Net revenues:
Company-operated retail $ 2,965,618 85.4% $ 484,006 80.3% $ – – % $ 3,449,624
Specialty:
Licensing 301,175 8.7 108,376 18.0 – – 409,551
Foodservice and other 205,659 5.9 10,688 1.7 – – 216,347
Total specialty 506,834 14.6 119,064 19.7 – – 625,898
Total net revenues 3,472,452 100.0 603,070 100.0 – – 4,075,522
Cost of sales and related occupancy costs 1,363,267 39.3 322,661 53.5 – – 1,685,928
Store operating expenses 1,199,020 40.4 (1) 180,554 37.3
(1) – – 1,379,574
Other operating expenses 119,960 23.7 (2) 21,386 18.0
(2) – – 141,346
Depreciation and amortization expenses 167,138 4.8 38,563 6.4 32,106 0.8 237,807
General and administrative expenses 45,007 1.3 44,352 7.4 155,191 3.8 244,550
Income from equity investees 28,484 0.8 9,912 1.6 – – 38,396
Operating income/(loss) $ 606,544 17.5% $ 5,466 0.9% $ (187,297) (4.6)% $ 424,713
(1) Shown as a percentage of related Company-operated retail revenues.
(2) Shown as a percentage of related total specialty revenues.
weeks ended October 3, 2004, from 5.8% for the corresponding
52-week fi scal 2003 period, primarily due to the leverage of
fi xed depreciation expenses from the extra sales week in 2004.
General and administrative expenses increased to $304 million in
fi scal 2004, compared to $245 million in fi scal 2003, primarily due
to higher payroll-related expenditures. As a percentage of total net
revenues, general and administrative expenses decreased to 5.7%
for the 53 weeks ended October 3, 2004, from 6.0% for the
52 weeks ended September 28, 2003.
Operating income increased 43.7% to $610 million in fi scal
2004, from $425 million in fi scal 2003. The operating margin
increased to 11.5% of total net revenues in fi scal 2004, compared
to 10.4% in fi scal 2003, primarily due to leverage gained
on most fi xed operating costs distributed over an expanded
revenue base, partially offset by higher dairy and green coffee
commodity costs.
Income from equity investees was $61 million in fi scal 2004,
compared to $38 million in fi scal 2003. The increase was
primarily due to volume-driven operating results for The
North American Coffee Partnership, which produces bottled
Frappuccino® and Starbucks DoubleShot® coffee drinks,
and improved profi tability of Starbucks Coffee Japan, Ltd.
(“Starbucks Japan”). The July 2003 increase in the Company’s
ownership interest from 5% to 50% in the Taiwan and Shanghai
licensed operations also contributed to the growth.
Net interest and other income, which primarily consists of
interest income, increased to $14 million in fi scal 2004, from
$12 million in fi scal 2003. The growth was a result of interest
income earned on higher cash and liquid investment balances
during fi scal 2004, compared to the prior year.
Income taxes for the 53 weeks ended October 3, 2004, resulted
in an effective tax rate of 37.2%, compared to 38.5% in fi scal
2003. The lower effective tax rate was primarily due to improved
operating results as fewer nondeductible losses were generated
from international markets, which are in various phases
of development.