Starbucks 2004 Annual Report Download - page 11
Download and view the complete annual report
Please find page 11 of the 2004 Starbucks annual report below. You can navigate through the pages in the report by either clicking on the pages listed below, or by using the keyword search tool below to find specific information within the annual report.-
 1
1 -
 2
2 -
 3
3 -
 4
4 -
 5
5 -
 6
6 -
 7
7 -
 8
8 -
 9
9 -
 10
10 -
 11
11 -
 12
12 -
 13
13 -
 14
14 -
 15
15 -
 16
16 -
 17
17 -
 18
18 -
 19
19 -
 20
20 -
 21
21 -
 22
22 -
23
-
24
-
25
-
26
-
27
-
28
-
29
-
30
-
31
-
32
-
33
 |
 |

22 Fiscal 2004 Annual Report
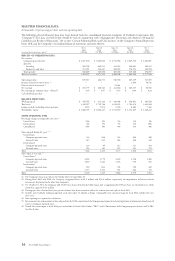
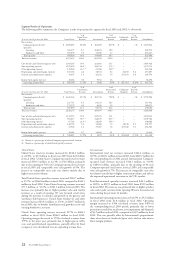
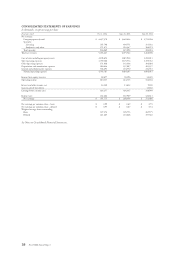
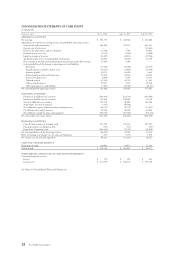
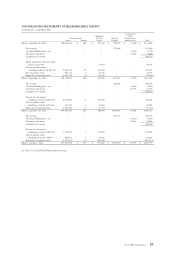
Segment Results of Operations
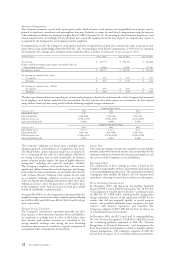
The following tables summarize the Company’s results of operations by segment for fi scal 2003 and 2002 (in thousands):
% of % of % of
United States International Unallocated Total Net
52 weeks ended September 28, 2003 United States Revenue International Revenue Corporate Revenue Consolidated
Net revenues:
Company-operated retail $ 2,965,618 85.4% $ 484,006 80.3% $ – – % $ 3,449,624
Specialty:
Licensing 301,175 8.7 108,376 18.0 – – 409,551
Foodservice and other 205,659 5.9 10,688 1.7 – – 216,347
Total specialty 506,834 14.6 119,064 19.7 – – 625,898
Total net revenues 3,472,452 100.0 603,070 100.0 – – 4,075,522
Cost of sales and related occupancy costs 1,363,267 39.3 322,661 53.5 – – 1,685,928
Store operating expenses 1,199,020 40.4 (1) 180,554 37.3
(1) – – 1,379,574
Other operating expenses 119,960 23.7 (2) 21,386 18.0
(2) – – 141,346
Depreciation and amortization expenses 167,138 4.8 38,563 6.4 32,106 0.8 237,807
General and administrative expenses 45,007 1.3 44,352 7.4 155,191 3.8 244,550
Income from equity investees 28,484 0.8 9,912 1.6 – – 38,396
Operating income/(loss) $ 606,544 17.5% $ 5,466 0.9% $ (187,297) (4.6)% $ 424,713
% of % of % of
United States International Unallocated Total Net
52 weeks ended September 29, 2002 United States Revenue International Revenue Corporate Revenue Consolidated
Net revenues:
Company-operated retail $ 2,425,163 85.7% $ 367,741 79.8% $ – – % $ 2,792,904
Specialty:
Licensing 227,711 8.1 84,221 18.3 – – 311,932
Foodservice and other 175,379 6.2 8,693 1.9 – – 184,072
Total specialty 403,090 14.3 92,914 20.2 – – 496,004
Total net revenues 2,828,253 100.0 460,655 100.0 – – 3,288,908
Cost of sales and related occupancy costs 1,114,535 39.4 235,476 51.1 – – 1,350,011
Store operating expenses 961,617 39.7 (1) 148,165 40.3
(1) – – 1,109,782
Other operating expenses 87,718 21.8 (2) 18,366 19.8
(2) – – 106,084
Depreciation and amortization expenses 142,752 5.0 34,069 7.4 28,736 0.9 205,557
General and administrative expenses 33,928 1.2 35,007 7.6 165,646 5.0 234,581
Income from equity investees 19,182 0.7 14,263 3.1 – – 33,445
Operating income/(loss) $ 506,885 17.9% $ 3,835 0.8% $ (194,382) (5.9)% $ 316,338
(1) Shown as a percentage of related Company-operated retail revenues.
(2) Shown as a percentage of related total specialty revenues.
United States
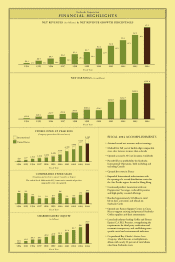
United States total net revenues increased by $644.2 million,
or 22.8%, to $3.5 billion in fi scal year 2003 from $2.8 billion
in fi scal 2002. United States Company-operated retail revenues
increased $540.5 million, or 22.3%, to $3.0 billion, primarily
due to the opening of 506 new Company-operated retail stores
in fi scal 2003 and comparable store sales growth of 9%. The
increase in comparable store sales was almost entirely due to
higher transaction volume.
Total United States specialty revenues increased $103.7 million,
or 25.7%, to $506.8 million in fi scal 2003, compared to $403.1
million in fi scal 2002. United States licensing revenues increased
$73.5 million, or 32.3%, to $301.1 million in fi scal 2003. The
increase was primarily due to higher product sales and royalty
revenues as a result of opening 315 new licensed retail stores
during the previous 12 months and growth in the grocery and
warehouse club businesses. United States foodservice and other
revenues increased $30.3 million, or 17.3%, to $205.7 million in
fi scal 2003, due to broader distribution and growth in new and
existing foodservice accounts.
United States operating income increased 19.7% to $606.5
million in fi scal 2003, from $506.9 million in fi scal 2002.
Operating margin decreased to 17.5% of related revenues from
17.9% in the prior year, primarily due to higher green coffee
costs and payroll-related expenditures, partially offset by fi xed
occupancy costs distributed over an expanding revenue base.
International
International total net revenues increased $142.4 million, or
30.9% , to $603.1 million in fi scal 2003, from $460.7 million for
the corresponding fi scal 2002 period. International Company-
operated retail revenues increased $116.3 million, or 31.6%,
to $484.0 million, primarily due to the opening of 96 new
Company-operated retail stores in fi scal 2003 and comparable
store sales growth of 7%. The increase in comparable store sales
was almost entirely due to higher transaction volume and refl ects
the improved operational execution in the U.K. market.
Total International specialty revenues increased $26.1 million,
or 28.1%, to $119.1 million in fi scal 2003, from $92.9 million
in fi scal 2002. The increase was primarily due to higher product
sales and royalty revenues from opening 284 new licensed retail
stores during the previous 12 months.
International operating income increased 42.5% to $5.5 million
in fi scal 2003, from $3.8 million in fi scal 2002. Operating
margin increased to 0.9% of related revenues from 0.8% in
the corresponding fi scal 2003 period, primarily due to lower
provisions recorded for retail store asset impairment and disposals
of $3.7 million in fi scal 2003, compared to $13.9 million in fi scal
2002. This was partially offset by International’s proportionate
share of net losses in Starbucks Japan and a shift in sales mix to
lower-margin products.